Platform
Use Cases
Many Possibilities. One Platform.
AI and Automation
The Always-on Incrementality Platform
Solutions
Teams
Built for your whole team.
Industries
Trusted by all verticals.
Mediums
Measure any type of ad spend

In the world of marketing measurement, “data-driven” has become a badge of honor. But let’s be honest - a lot of marketers are driving Lamborghinis with the check engine light on. If your data is garbage, no amount of dashboards, attribution models, or AI-generated insights can save you. You’ll just end up making expensive mistakes faster.
The truth is, marketing data isn’t bad because marketers are lazy. It’s bad because data quality is hard, especially when the tools marketers rely on were never designed to work together. Every integration, every event, every campaign touchpoint is an opportunity for something to go wrong. And often, it does.
So, how do you fix it?
Below are six of the most common data quality issues that plague marketing operations - along with practical, tactical ways to clean them up and finally start trusting your data again.
It sounds obvious, but we’ve seen countless cases where event timestamps were misaligned by hours - or even full days. When app events are reported in UTC and campaign events are logged in local time (or vice versa), you end up measuring campaign impact with a broken ruler.
Fix it:
Standardize your time zone across all platforms. Decide whether you’ll use UTC, a specific region, or local time based on user geography - but pick one and stick with it across campaign tracking, app events, CRM, and reporting.
A click is not a conversion, and a download is not revenue. If your event stream is missing revenue-generating actions - purchases, subscriptions, upgrades - your entire performance measurement model is incomplete.
We’ve seen setups where “conversion” was just an app install. Great for vanity metrics. Terrible for actual business outcomes.
Fix it:
Audit your event taxonomy and make sure your revenue events (not just front-end interactions) are captured, timestamped, and passed through to your measurement platform. Test them across platforms and devices. It’s better to over-validate than to fly blind.
We see this with Cross platform advertisers all the time – companies who’s product is available both as an App as well as a website. If you treat a user on iOS and that same user on Chrome as two different people, you’re going to get two versions of reality. Device fragmentation, browser privacy restrictions, and poor identity stitching can all distort your picture of what users are actually doing.
Fix it:
Use deterministic identifiers when possible (user IDs, login events) to connect activity across devices and platforms. Treat your attribution platform (MMP) only as a proxy, as that is exactly what it is. If your app and web funnels are separate, bring them together into a unified view. Even if probabilistic stitching isn’t perfect, it’s better than pretending cross-device behavior doesn’t exist.
One of the sneakiest sources of bad data is over-crediting marketing efforts for actions that would have happened anyway. If your model doesn’t account for baseline organic activity, you’re just measuring lift on top of a cloud of assumptions.
This often happens when marketers assume that every spike in activity is due to a campaign - even when no campaign was live.
Fix it:
Separate organic and paid baselines. Measure incremental marketing - not just correlation. Use control groups, ghost ads, geo splits, or causal inference methods to determine what would have happened without the campaign. Or use INCRMNTAL. Ahhm ahhm…
If you’re wondering how to measure incrementally, focusing on experimental design and causal inference is key to understanding true campaign impact.
Some campaigns die fast. Others haunt your data for weeks. If you’re only measuring conversions within a narrow window (say, 7 days), you may be missing a long tail of delayed revenue - especially for high-consideration products.
We’ve seen cases where 30% of a campaign’s impact showed up more than a week after the spend ended. If you cut it off early, you get false negatives - and pause campaigns that were actually working.
Fix it:
Use a flexible attribution window and monitor delayed conversions. If your product has a long decision cycle, consider building a “tail curve” to understand time-to-conversion patterns. And when in doubt, over-collect - you can always narrow later.
Challenge your attribution windows at least once every few months. Things change faster than you think.
In too many marketing teams, integrations are layered like lasagna. You’ve got Google Ads talking to GA4, Meta Ads pushing to your MMP, your CRM syncing to your data warehouse… and somewhere in there, Slack is getting a summary from Zapier every Wednesday.
This kind of stack often results in duplicated events, mismatched campaign names, and conflicting reports that nobody can explain.
Fix it:
Centralize your naming conventions. Use standardized campaign naming, event structures, and attribution models across platforms. Assign one owner to maintain the taxonomy, and treat your marketing stack like software - version it, test it, and monitor for breaks.
For that, leveraging a marketing data analyst can help unify your data and maintain consistent tracking standards across platforms.
Yes, platforms like Meta, TikTok, AppLovin, Snapchat, Moloco, IronSource, Google, and your MMPs all play a role in how data is tracked and reported. But no platform is going to care about your data quality more than you do.
Treat your data pipelines like product infrastructure. Monitor them. Stress test them. Build alerts for anomalies. And don’t rely on gut feeling when something “seems off” - investigate.
Using AI in data analysis can assist with anomaly detection and automate parts of this monitoring, but it’s not a substitute for ownership.
In a world drowning in dashboards, the marketers who win aren’t the ones with the most colorful charts - they’re the ones who know how to get the numbers right before putting them on display.
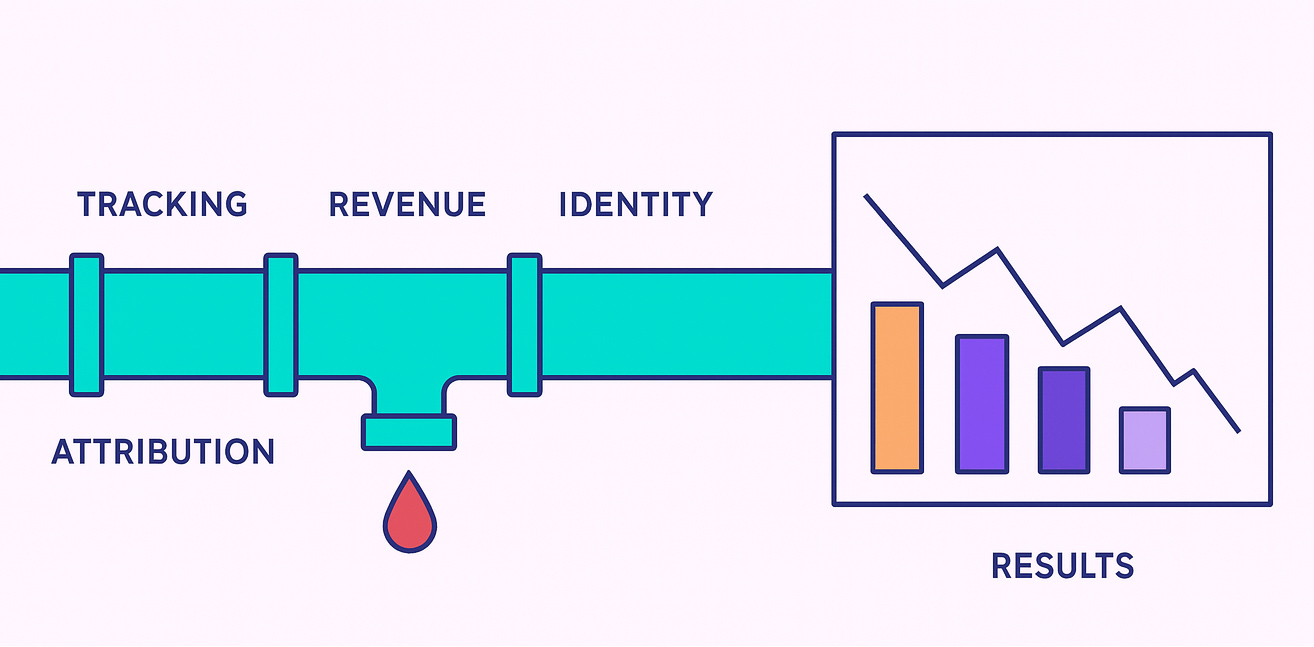
So before you hire your next data scientist or buy another fancy BI tool, ask yourself: Have I fixed the pipes?