Platform
Use Cases
Many Possibilities. One Platform.
AI and Automation
The Always-on Incrementality Platform
Solutions
Teams
Built for your whole team.
Industries
Trusted by all verticals.
Mediums
Measure any type of ad spend
The Super Bowl is the rare day in the United States. It’s a day when it feels as if the entire country is doing the same thing at the same time. That concentration is the whole point, and it is why the economics are so absurd. Super Bowl LX averaged 124.9 million viewers.
A single 30-second ad slot ran more than $8 million, and some spots reportedly pushed even higher.
Now here is the truth:
When demand spikes like that, traditional marketing dashboards become an unreliable narrator.
Conversions go up. CPAs go down. Everyone high-fiving one another, and the board deck practically writes itself. But a lot of that movement is the Super Bowl itself moving people, not the Super Bowl ads. That difference is the difference between performance marketing and performance theater.
I analyzed eight client event studies (daily exports from INCRMNTAL Explorer) around Super Bowl weekend. I didn’t ask “what happened?”. What happened is easy.
I asked the same question every marketer should ask, but almost nobody answers cleanly:
What was incremental?
Incremental is what happened because of you.
I used two lenses, because the Super Bowl creates two different forces at the same time:
First, Super Bowl ads. A few of our customers ran ads during the Super Bowl. Even with a $8M price tag – reaching almost everyone in the country in a single moment is pretty powerful, and great creative can create genuine incremental demand. Kantar has long argued that Super Bowl advertising can improve brand perceptions and drive incremental sales and ROI.
Second Lens was around brands that would be affected by the Super Bowl. Streaming services, services that are related to Bad Bunny
So I separated two questions:
A) If a brand ran Super Bowl ads, what was the incrementality of those ads?
B) If a brand was impacted by the Super Bowl, what was the incrementality from the Super Bowl itself, after controlling for spend changes and basic seasonality?
For advertisers, I leaned on the marginal incrementality outputs already in the INCRMNTAL Explorer exports. For impacted clients, I fit a simple pre-event counterfactual model (spend + weekday seasonality + trend) and looked at the residual demand lift during and after the game.
That is not perfect, but it is far better than telling yourself a fairy tale because CPA went down.
The most important finding you should take from my analysis is this one: Volume doesn’t mean incrementality.
One sports betting client saw a monster surge in new conversions during the Super Bowl weekend. Total deposits roughly tripled versus baseline. Average CPA collapsed.
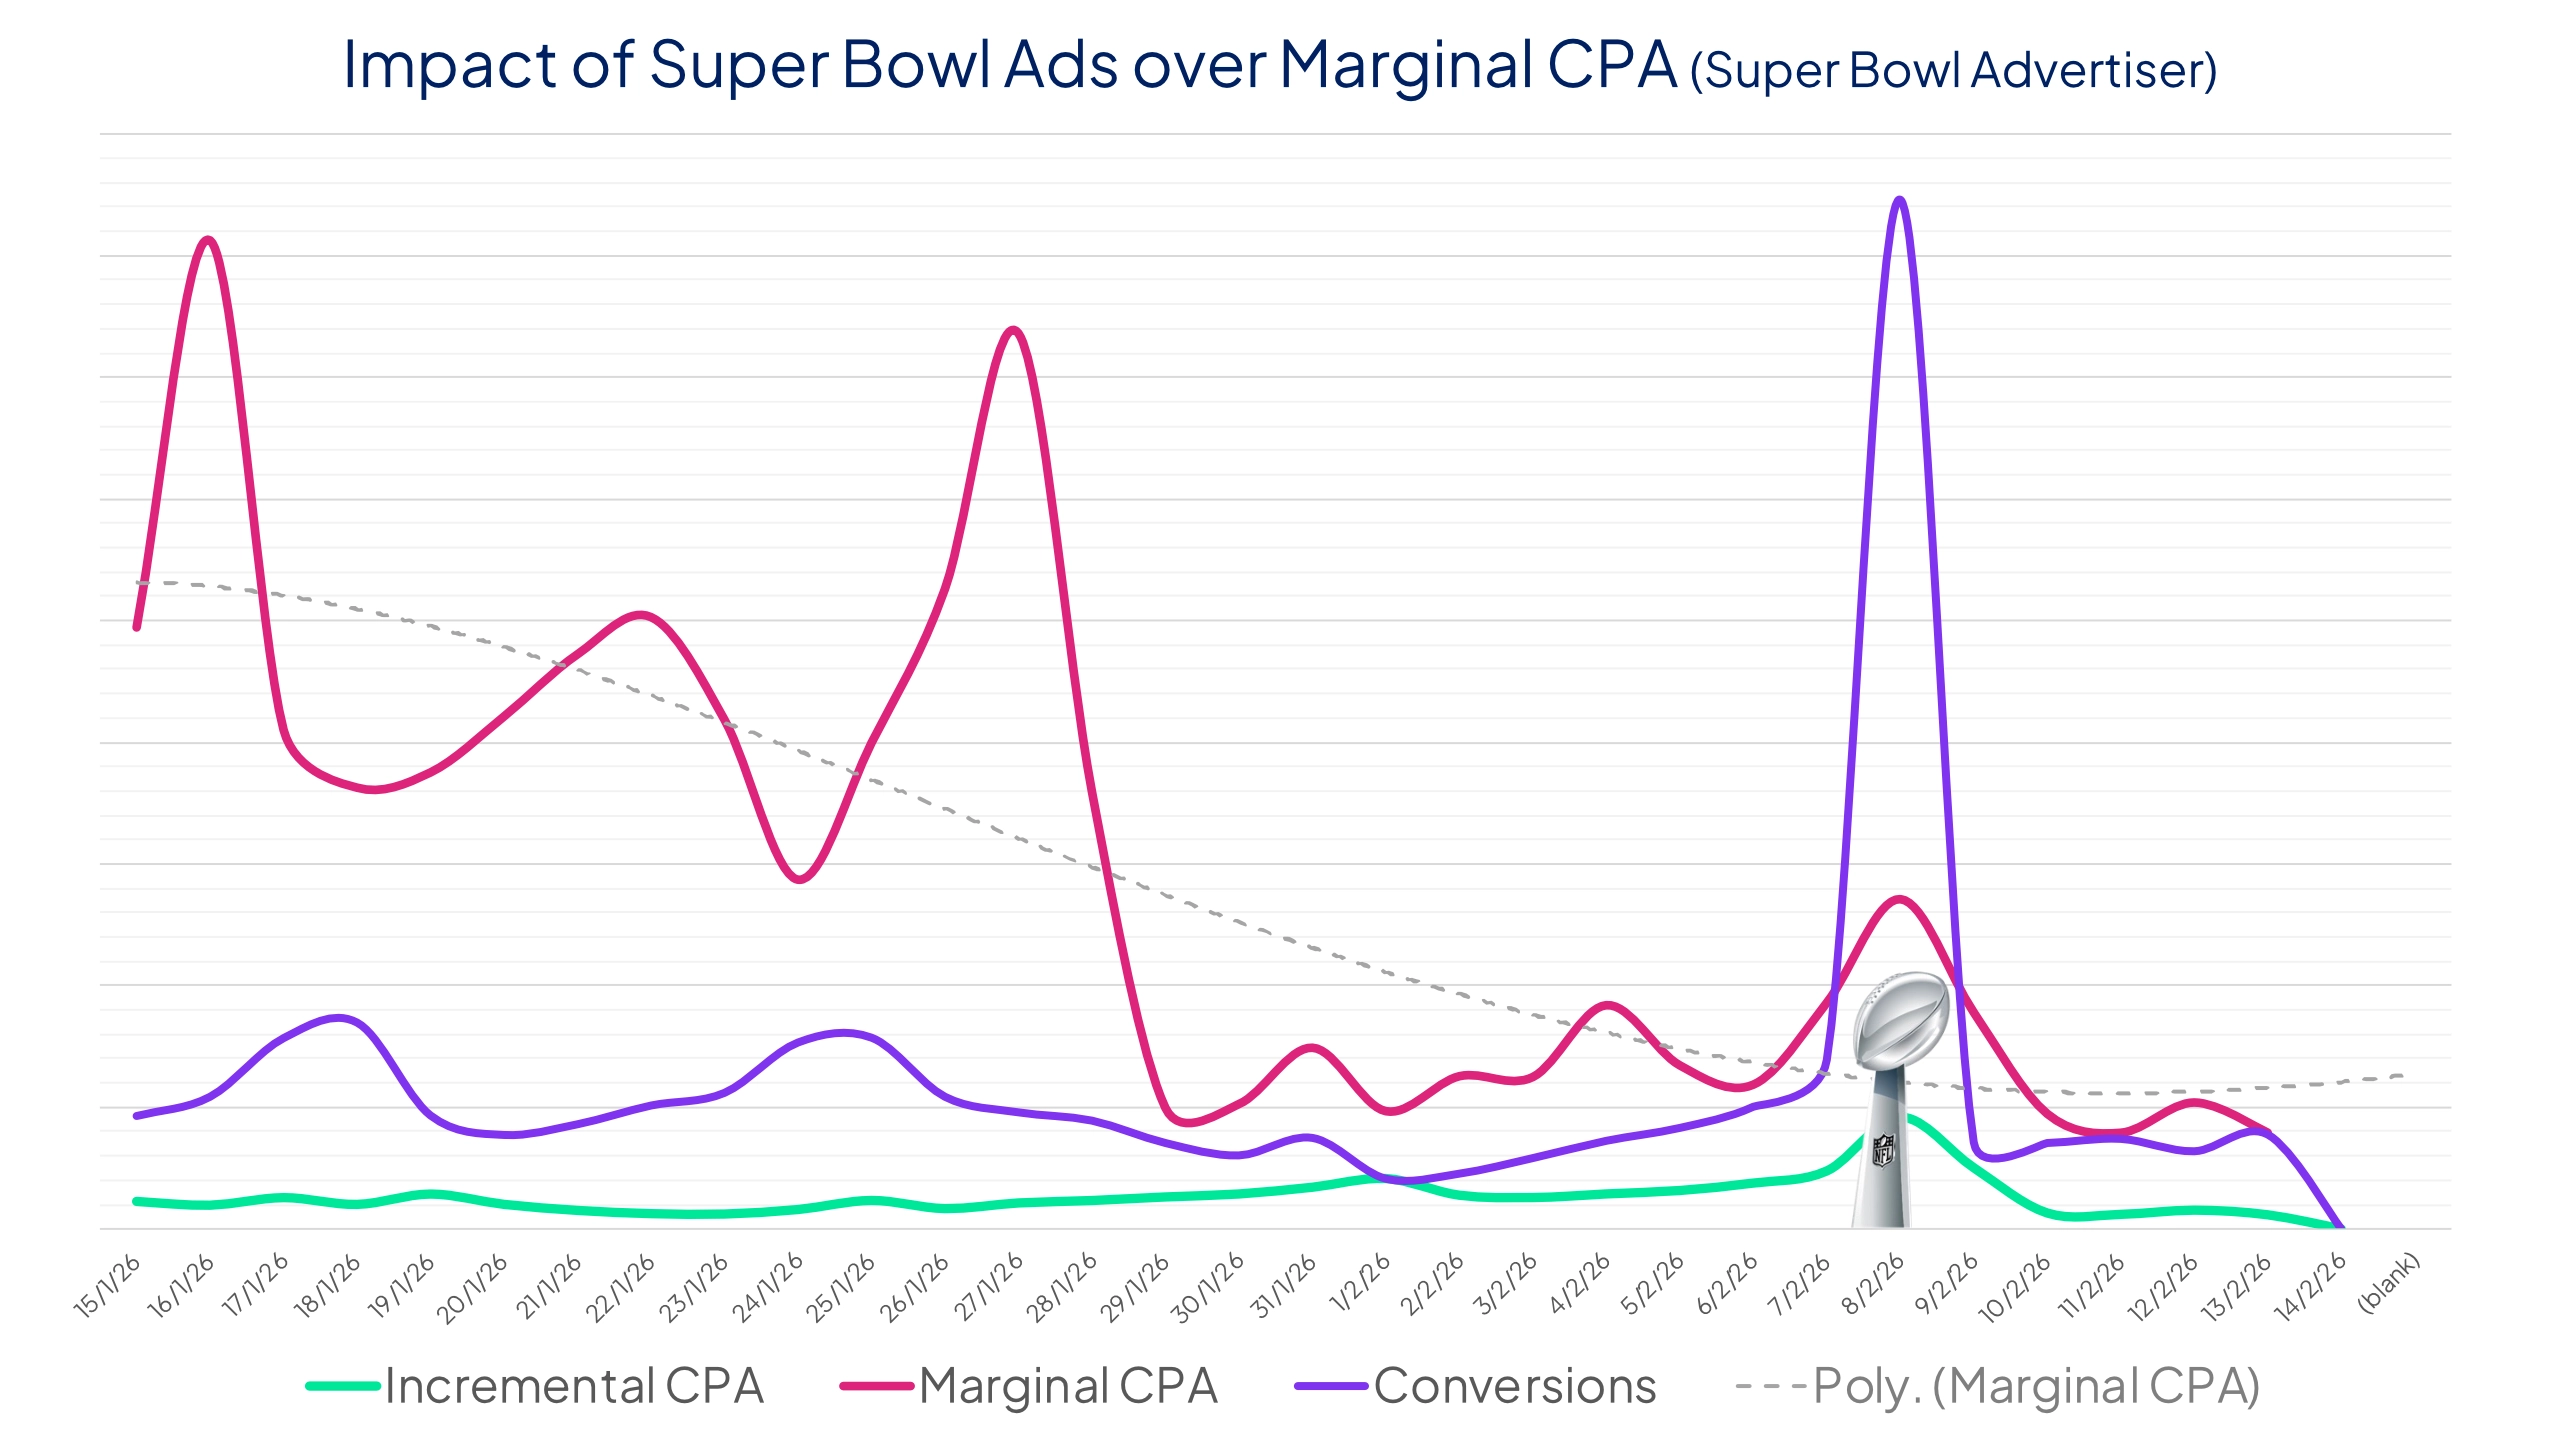
If you stop there, you declare victory.
But the marginal incrementality view told a different story: during the event window, only about 0.6% of those conversions were estimated to be incremental to paid spend. Effective marginal CPA was over 10x the average CPA. In plain language: demand was so strong that additional spend was mostly paying for outcomes that were going to happen anyway.
This is exactly why the Super Bowl can make last-touch and blended CPA look genius. The event creates a wave, and you get credited for the wave.
Now watch how this flips for a different Advertiser.
For one advertiser, the Super Bowl weekend was meaningfully incremental. Across the three-day event window, estimated incremental registrations were about 15x the typical daily average vs. the 5x increase in average daily ad spend, implying an effective marginal CPA 3x lower than average.
That is not a rounding error. That is real incremental volume.
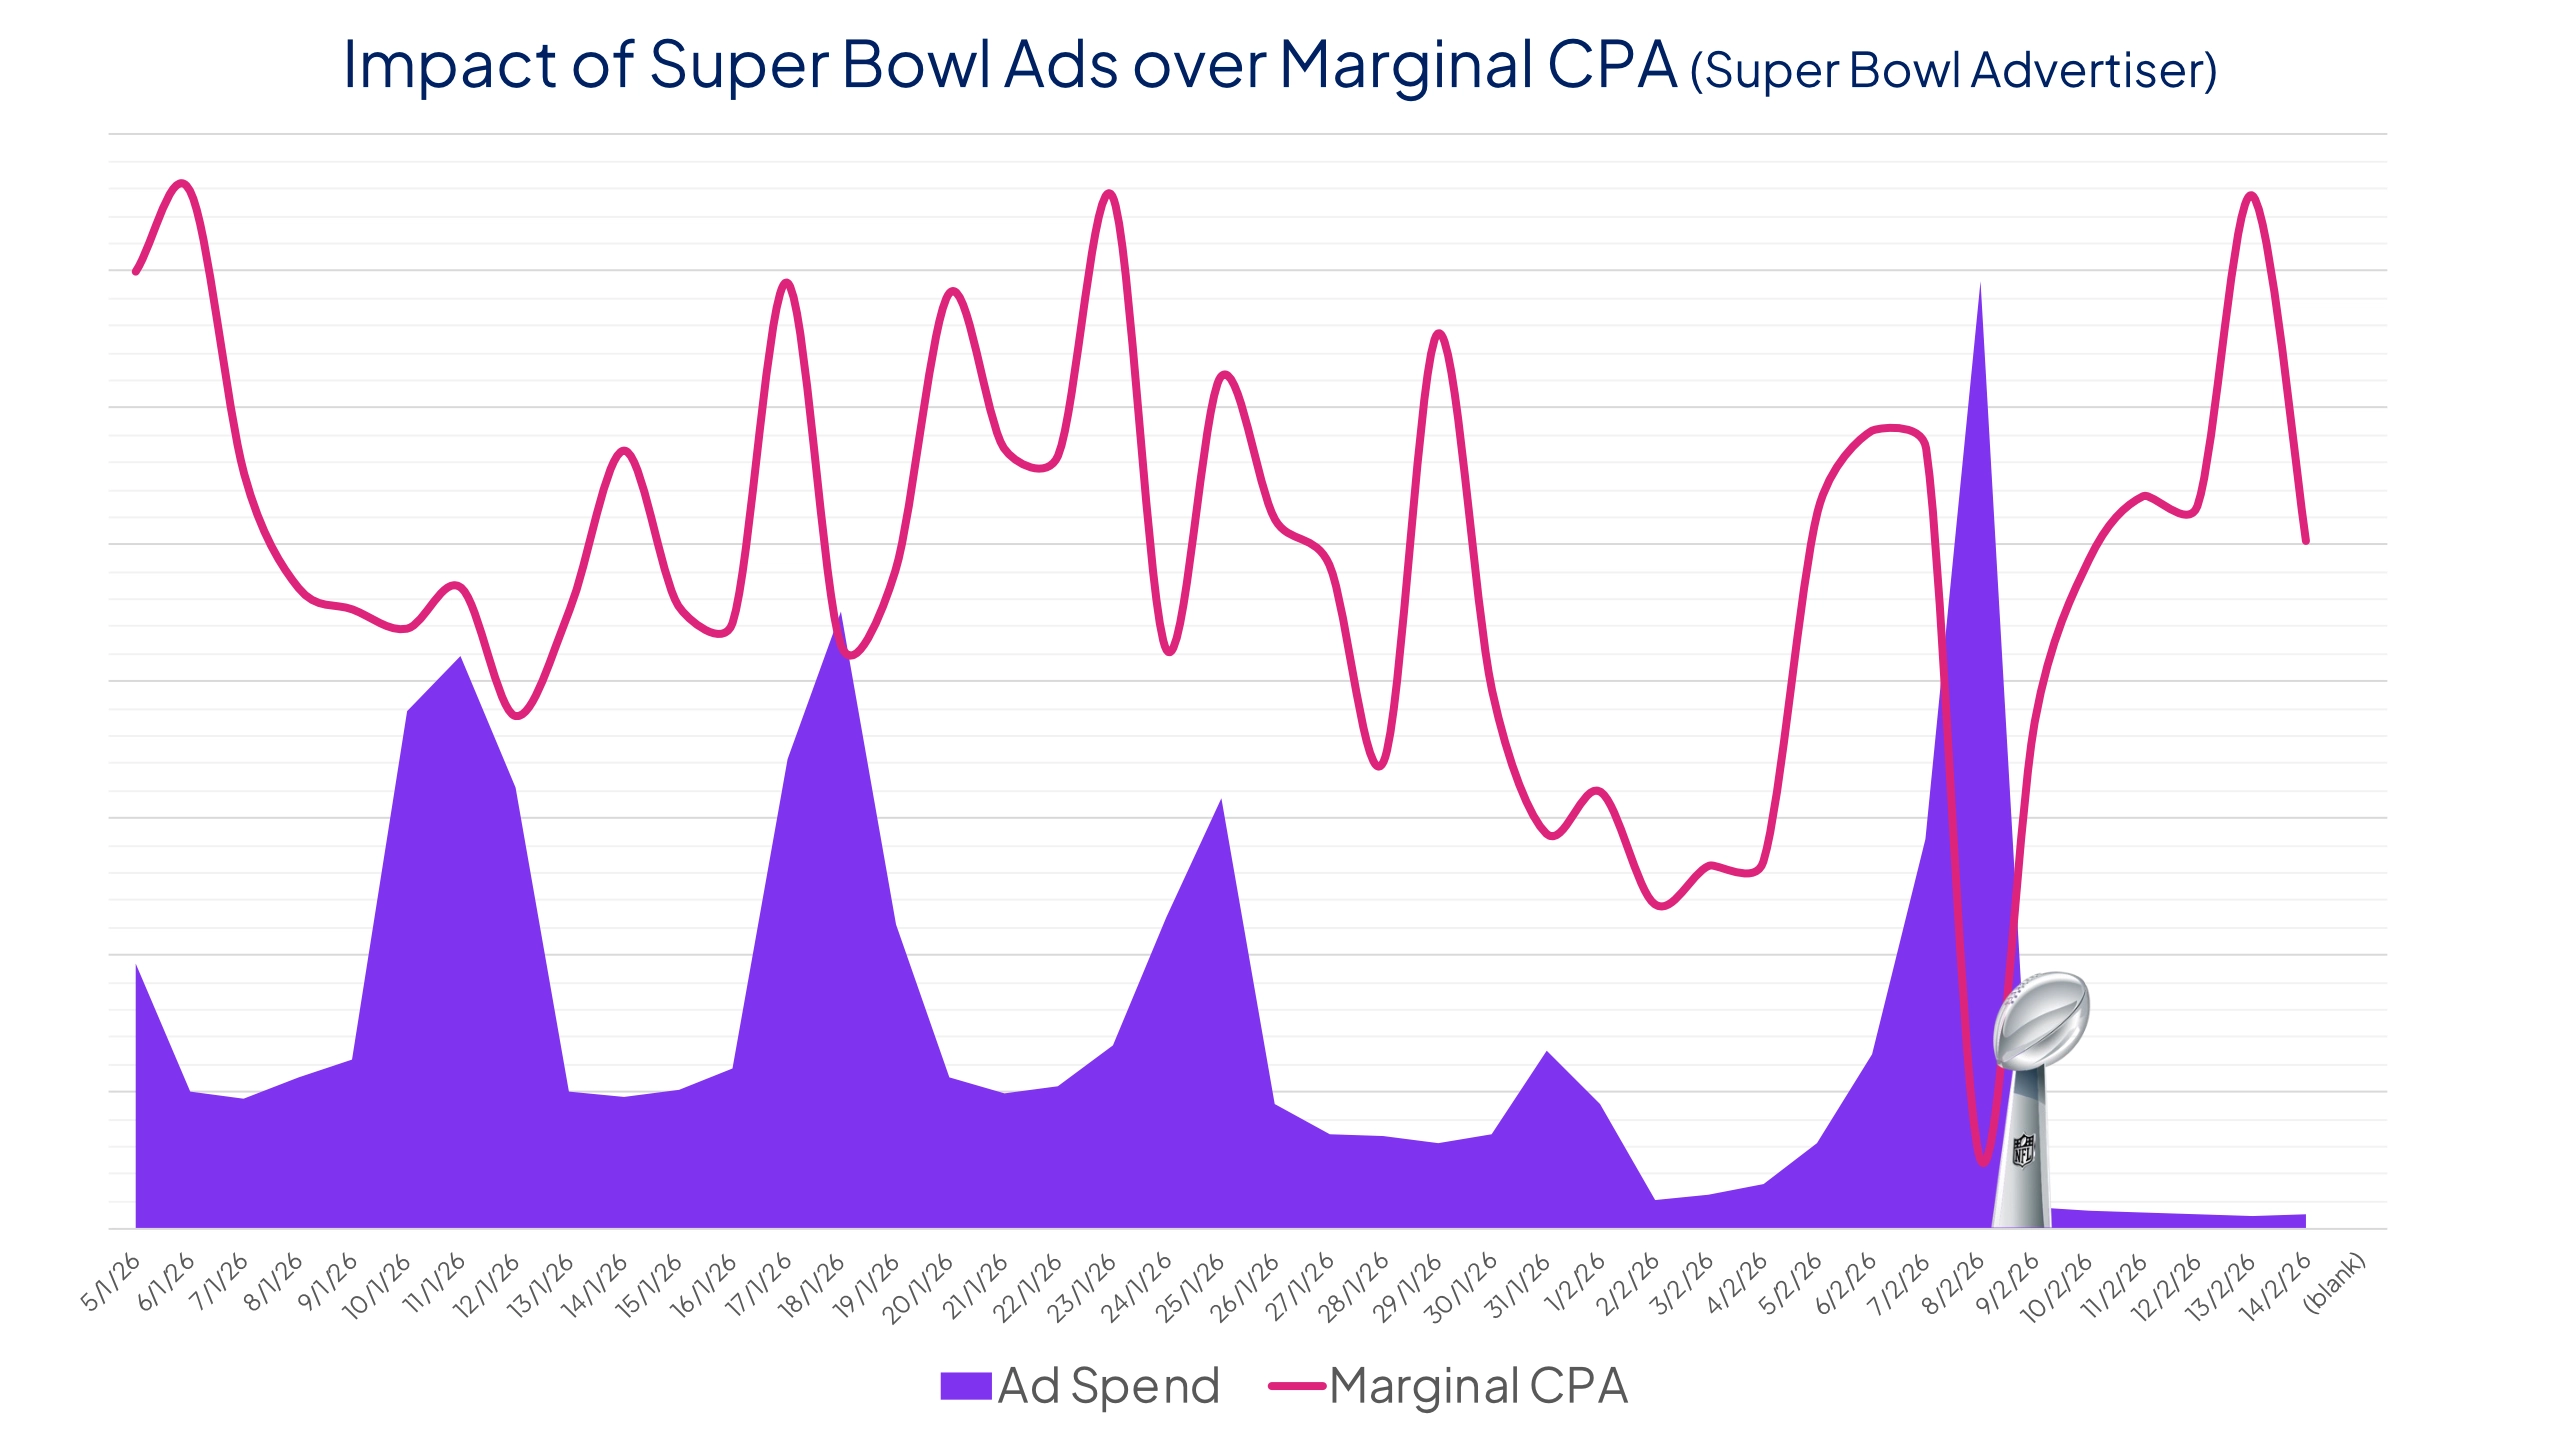
Here is the kicker: the same advertiser, same weekend, same spend pattern, and a different KPI (purchases) looked almost non-incremental. Engagement exploded, but incremental purchases share was under 1%.
This is not random. It is the funnel.
Top-of-funnel outcomes can be created. Mid-funnel engagement, especially on the biggest sports night of the year, is often already maxed out and will take time to show up in reports.
The Super Bowl is not just the game, it is the culture around it. That matters because conversions do not always happen in real time.
In 2026, the halftime show featuring Bad Bunny, created massive social reach and a cultural tail.
One of our language learning app customers did not peak on game day - It peaked after – as Bad Bunny singing in Spanish lead people to want to learn Spanish themselves, with a meaningful post-event uplift that remained even after accounting for spend and seasonality.
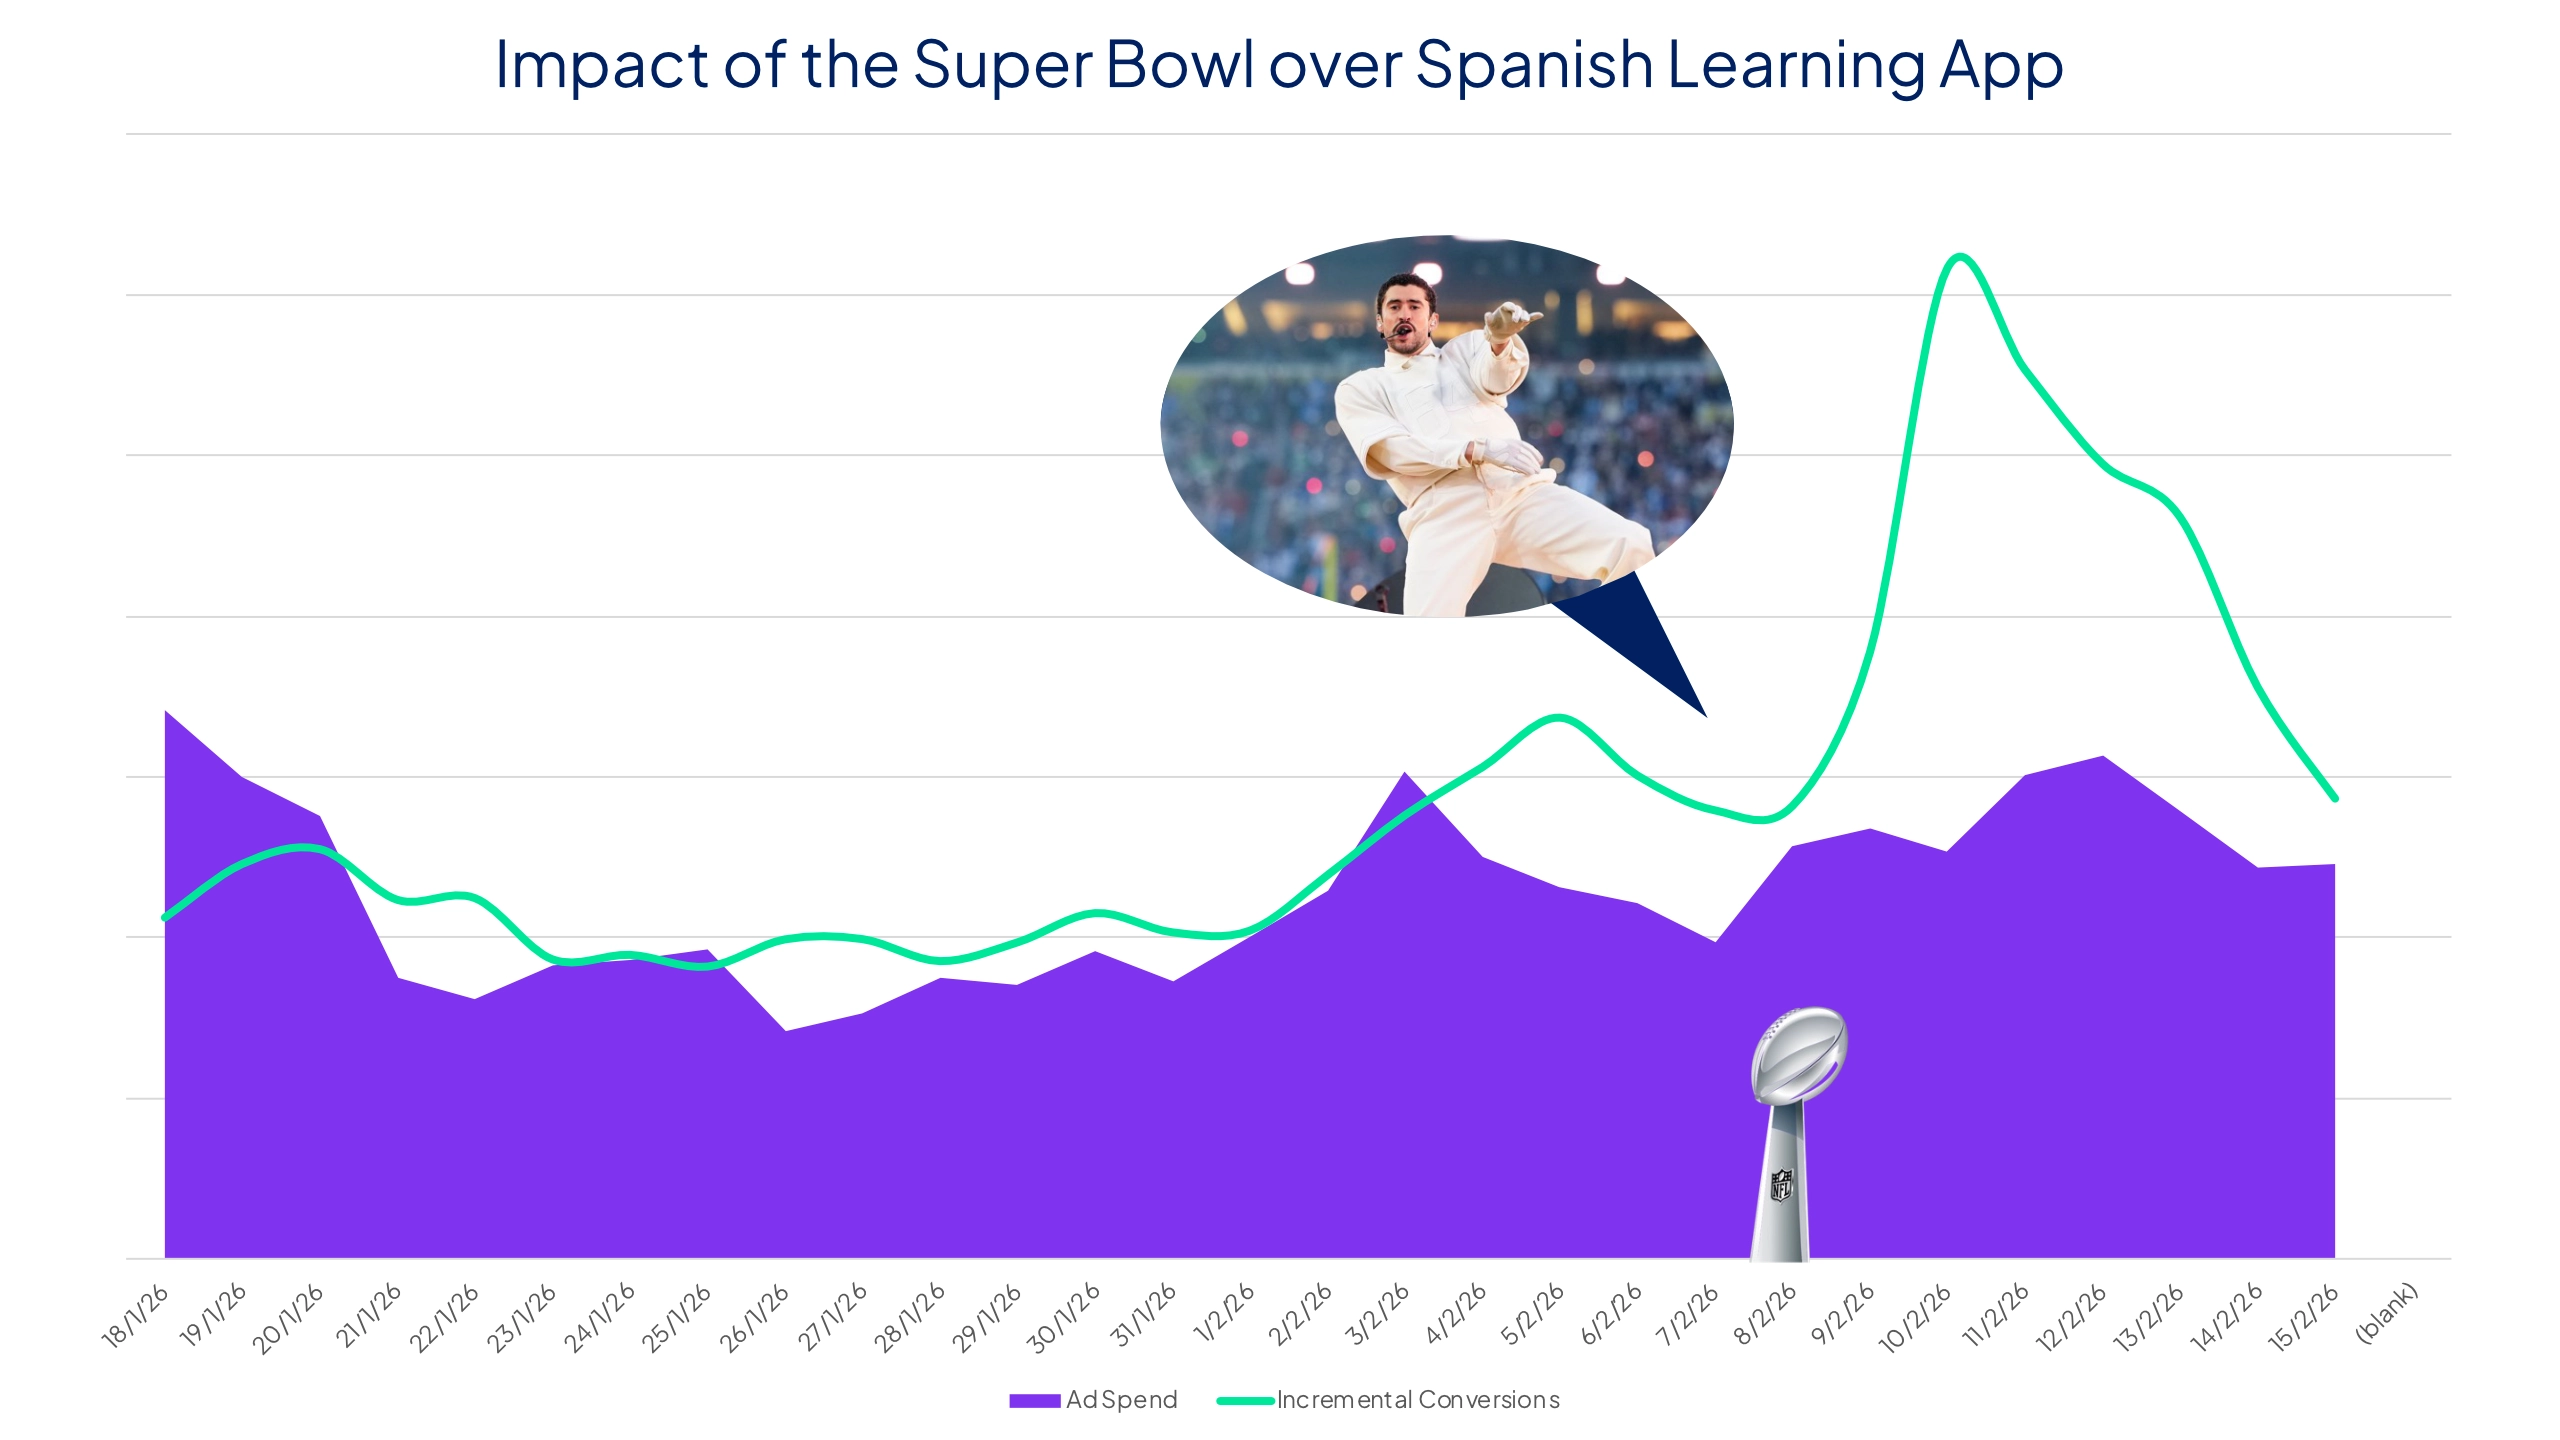
That is the play many brands miss. They buy the moment, then ignore the halo effect.
If you are going to spend into the Super Bowl, plan the time before and after like it matters, because it does.
Here is the practical playbook I wish more teams followed.
Is it acquisition? Brand? Engagement? Competitor defense? If you cannot answer that in one sentence, do not buy the inventory.
Average CPA will flatter you during a demand shock. Marginal CPA will tell you whether additional dollars are doing work.
The event creates a cultural tail. If you are not set up to harvest it, you are leaving value on the table.
If your KPI definition changes mid-window, or you cannot separate event demand from media demand, you will spend millions to learn nothing.
The Super Bowl is the biggest attention spike in marketing. That is why it is priced like a luxury good.
But the real value is not “did conversions go up?” of course they would. The question is: did they go up because of you?
Sometimes, yes. Sometimes, absolutely not.
If you want to spend into the Super Bowl, do it with eyes open, with marginal incrementality in hand, and with the humility to admit that the biggest day in America can bring it on!
About this analysis:
This analysis took into consideration 8 brands, 4 of ran ads during the Super Bowl, and 4 had a strong impact due to the Super Bowl event. The total US ad spend observed across these brands between January 15th and February 14th (2026) sums at $638M.
This analysis fully utilized INCRMNTAL’s always-on incremental and marginal results by day.
For more information about this analysis, please reach out to sales@incrmntal.com , or schedule a call with one of our team members

Maor is the CEO & Co-Founder at INCRMNTAL. With over 20 years of experience in the adtech and marketing technology space, Maor is well known as a thought leader in the areas of marketing measurement. Previously acting as Managing Director International at inneractive (acquired by Fyber), and as CEO at Applift (acquired by MGI/Verve Group)