Platform
Use Cases
Many Possibilities. One Platform.
AI and Automation
The Always-on Incrementality Platform
Solutions
Teams
Built for your whole team.
Industries
Trusted by all verticals.
Mediums
Measure any type of ad spend
We will NEVER launch an index scoring ad platforms. An ad platform can be great for one advertiser, but horrible for another. An ad platform can be great for an advertiser in one country, but be detrimental in another. An ad platform can be awesome in July, but redundant in September. Value is relative, and the definition of relative changes over time.
(Side harsh comment: Just look at the top 20 “top networks” on any performance indexes from a few years ago to see that many of those were later sued as being 100% fraudulent.)
With that said – we do have a ton of data, and as part of the QBR process with our customers, we made a decision to zoom onto on a channel, measuring this across every one of our customers, comparing the performance to the customers’ benchmarks and graded each measurement. During our first batch of QBRs, the channel we decided to zoom into was none other than Meta.
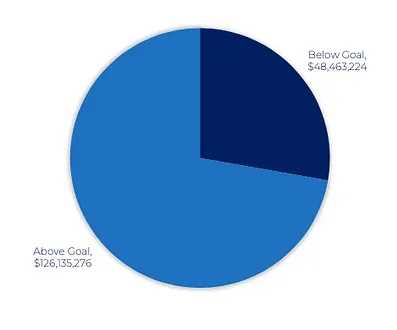
If you continue to read this article, you’ll learn a lot about the why, the how and the what. But if you’re just in here for the headline – this is what we saw: We’ve measured almost $200M ad spend on Meta and found $48M spend that is not efficient, or completely redundant. Worth mentioning that the majority of ad spend on Meta has been incremental and reaching or exceeding customer's benchmarks.
Meta is really popular with our customers. 95% of our customers are advertising through the platform – both those who advertise an app, those advertising a website, as well as retailers Our clients span across different industries and have different KPI metrics of success yet they almost all gravitate towards this platform.
The total ad spends on Meta represented almost 20% of the total ad spend we’ve seen in Q2.
Meta was also very interesting to zoom into as it was the company most affected by the impact of Apple’s ATT.
First, we must explain a bit our technology and methodology: INCRMNTAL is a platform that measures the incremental value of marketing activities. Rather than attempting to match between a users’ click and an action the user performed – we are using causal data science using micro-experiments to create a prediction showing: “what would have happened if you did not make the change you are measuring”
Rather than turn this article into a full blown pitch about how our tech works, if you’re interested to learn more –feel free to schedule a demo with us.
95% of our customers are active with Meta, and for those active, Meta represents anywhere between 0.5% and 79% of the total share of their wallet’s. The Q2 2022 ad spend we measured was $892M , out of which, $174M was spent across Meta and the Meta assets (Facebook, Instagram, Facebook Audience Network, Messenger)
We had two questions that we wanted to answer:
To answer these questions we measured the most significant actions our customers took across Meta during Q2 2022. Major campaigns launched, spend changes, restarts, pauses, turning the channel on or off.
Each measurement showed what (if any) was the incremental value of the action taken on Meta. i.e. if a customer increased ad spend from $100,000 to $150,000 – the measurement would show what is the actual incremental contribution the additional $50,000 ad spend incurred to the metrics the customer is measuring (typically: leads / installs / sales / revenues). Or if a customer reduced ad spend on Meta from $200,000 to $100,000 – the measurement would show what is the actual negative incremental value lost as a result of the $100,000 spend reduced.
To answer the 2nd question was slightly more complicated. Customers will often set ambitious goals. An advertiser who’s average CPA is $10 , may set a benchmark of $8 as they want to reduce the cost per action.
Rather than relying on our customer’s set benchmarks – we compared the performance Meta generated to the actual performance customers have.
Meaning, if a customers’ actual average CPA was $10 and the CPA generated across Meta was at $9 – we considered Meta as 11% above the customers’ benchmark.
None. We did not fudge the numbers, and have no conflicting interests against our customers nor Meta. We have no intention to show that “Meta is great” or “Meta is not great” to anyone. Our platform operates as an independent value measurement platform.
And if you know our pricing structure, you would know that we make an effort to prove that we are unbiased.
You’ll also note from the results below that we do not try to rationalize the results ourselves, but only present you with the dry data, as is.
Meta is showing consistent incrementality for all Travel & Mobility Advertisers. We couldn’t see the same across eCommerce, Retail, Lifestyle products, Gaming, and Fintech
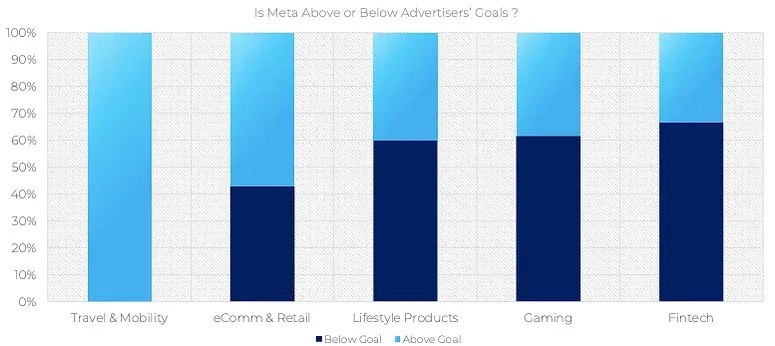
To fully anonymize and aggregate the data, the above graph aggregated advertisers from 14 different verticals into the 5 above. Four of these should be self explanatory, but for clarity, “Lifestyle” includes advertisers in the Dating, Social, Education, Entertainment, Photography, and Meditation space.
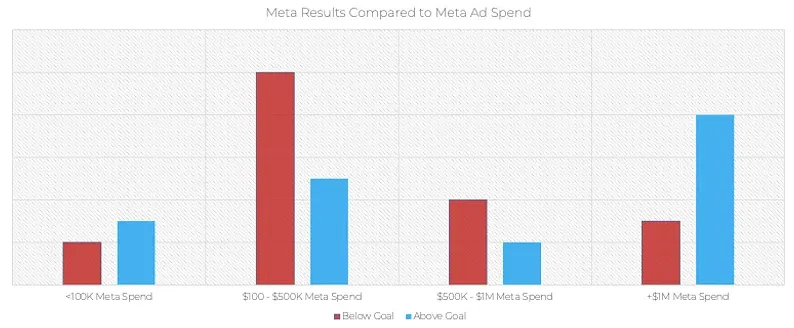
There was no correlation between the percent of spend Meta represented for an advertiser and the performance against benchmarks of the ad spend
This was a shock for us. We would have expected to see a clear correlation here. We expected that those spending almost 60% of their ad spend across Meta would be those where Meta’s performance would be absolutely fantastic without a doubt.
We were also happy to see substantial scaling opportunities for customers who are under leveraging the opportunity of increasing their ad spend.
Advertisers who have not yet scaled spend significantly on Meta are those who’s spend showed controversial results. Those who already reached scale with Meta are enjoying incremental results, consistently.
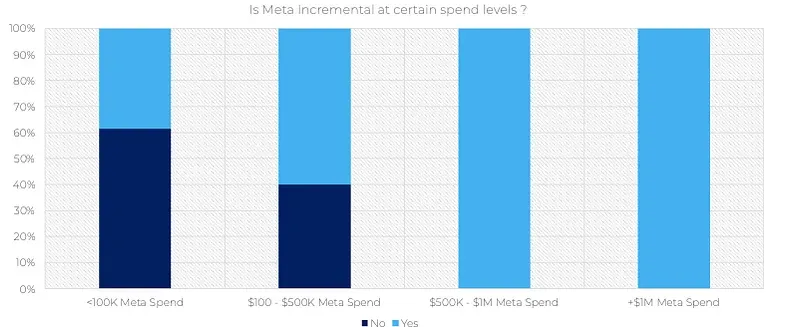
We were glad to see this graph. What we learned from this, is that those who are already spending over $500K per month with Meta were not wasting their budgets.
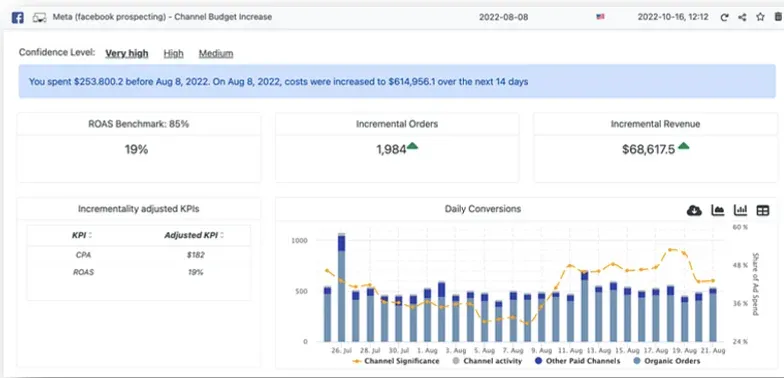
Before showing you the next graph, we wanted to explain something important: Incremental Results does not necessarily mean “good results”.
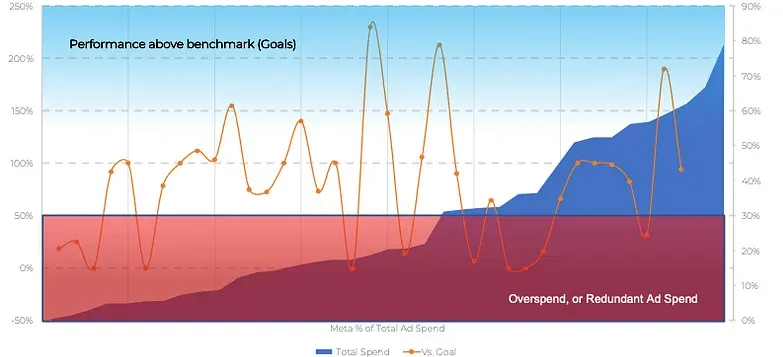
The following result is one of the measurements used in this analysis. This result is showing that a spend increase of $361K did yield incremental results, but with that said – the results were substantially below the customers’ actual ROAS benchmark.
While the average ROAS across all of this advertiser ad spend are just over 70% - the ROAS from this substantial spend increase was limited at 19% - i.e. 76% below benchmark.
There is an enormous amount of ad spend across Meta that is either below benchmark, or practically – redundant
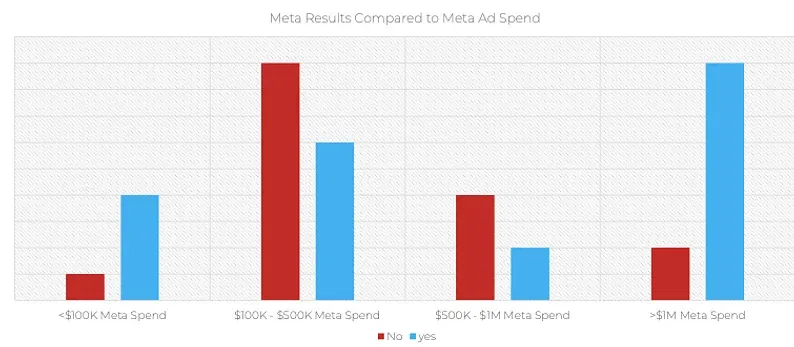
. To give a little bit of a credit to Meta here, rather than compare the performance to 100% of each Customers’ benchmark, we used 90% as the cut.
Even when we extended what is considered “above” benchmark to 75% of each Advertisers’ benchmark – the graph did not change much:
This led us to this final graph, showing that across all of our customers, we were able to identify $48M in ad spend across Meta that could be better used, or completely saved.
Thoughts ? Questions ? Feedbacks ?
We would love to hear from you.
We cannot and will not expose any customers’ measurements in the process, but we’re happy to talk more about this.
PS – We’ll likely focus on Google for the next QBR, but we’re talking requests ☺