Platform
Use Cases
Many Possibilities. One Platform.
AI and Automation
The Always-on Incrementality Platform
Solutions
Teams
Built for your whole team.
Industries
Trusted by all verticals.
Mediums
Measure any type of ad spend
A no-drama, data-backed look at spend, incrementality, and what actually worked during the loudest week of the year
Black Friday “season” compresses weeks of consumer expectation and demand into a few days of commerce explosion. Most measurement systems tend to panic when this happens, as they can’t react fast enough to such sudden changes.
This analysis looks across INCRMNTAL customers and highlights three clear patterns we saw during BF:
1. eCommerce scaled big time in November.
2. It scaled efficiently: +264% spend, only ~20% CPA increase.
3. Channel performance varied meaningfully: Meta led spend, but Google, TikTok and up-and-comers punched above their weight in yield (you’ll need to read more to get what we mean…)
Everyone spends more during Black Friday. That’s not an insight.
The real question is:
Does the additional spend actually create incremental outcomes, or did it just “buy” conversions that would have happened anyway?
That’s what we set to measure with INCRMNTAL Explorer, our always-on incrementality platform built using AI.
Incrementality experiments sound so tangible as a measurement method, but here’s the key point: Black Friday is exactly the moment where legacy incrementality experiments are hardest to run.
Because during these periods:
• demand curves shift rapidly
• advertisers are not willing to hold out meaningful budget
• promos create huuuge conversion swing that breaks stable baselines
• attribution gets noisier, not cleaner
INCRMNTAL doesn’t rely on attribution windows nor 4 week holdout tests. It measures incrementality daily by applying causal AI.
INCRMNTAL is designed for chaos - which means you can actually quantify lift during Black Friday, Cyber Monday, and Singles Day, not just guess confidently in a dashboard.
Traditional incrementality testing is built for stable environments: same audience structure, steady conversion rates, predictable baselines.
Black Friday is the opposite: it’s a turbulence simulator.
That’s why legacy incrementality experiments often fall apart during BF/CM/Singles Day:
• you don’t have time to run clean multi-week tests
• you can’t afford meaningful holdouts
• conversion rates surge unpredictably
• platform overlaps increase and attribution gets noisier
INCRMNTAL’s always-on modeling approach is designed to measure incrementality through these high-volatility moments - allowing teams to quantify impact during the exact windows where they’re spending the most money and taking the most risk.
We welcome you to learn more about our methodology here, or you can even schedule a conversation with one of our business development reps.
What data was used to run this analysis ?
Our marketing science and analytics team looked at the spend of 50 customers, across multiple verticals, with a total ad spend of $500M during the period October – December 24th to conduct this analysis.
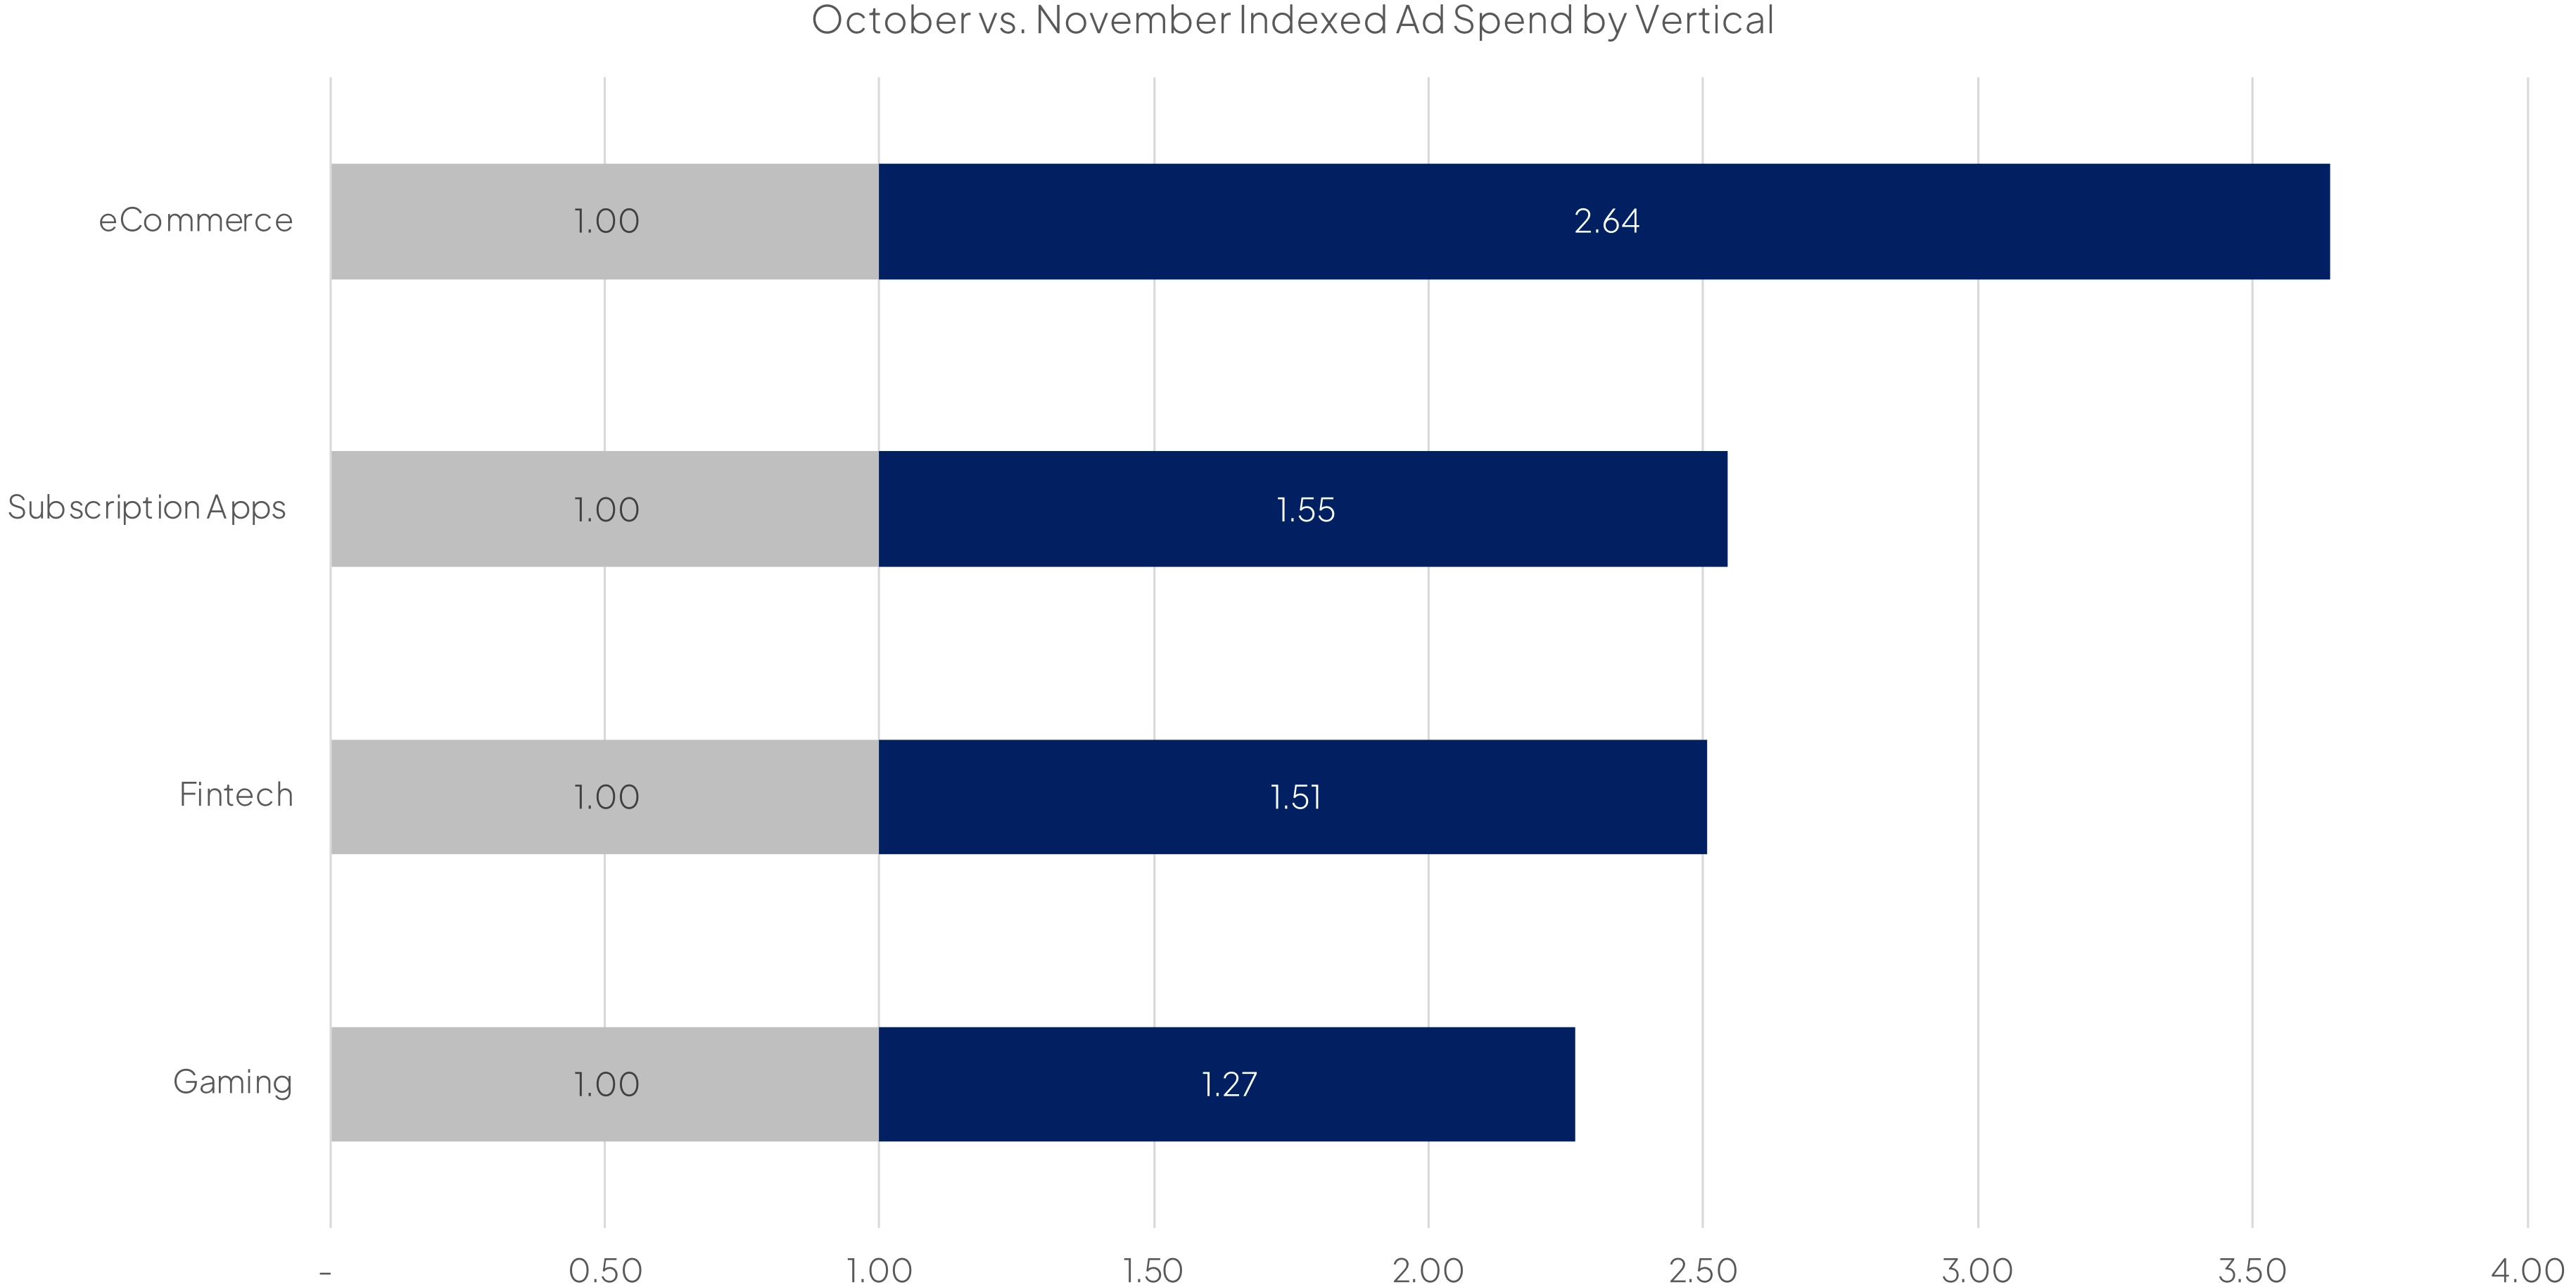
1) eCommerce Was the Biggest Scaler
This should not come as a surprise to anyone, but still worth mentioning. While in past years, we’ve seen advertisers in various verticals try and piggyback the BFCM hype – we saw much less of this attempt this year.
Across verticals, eCommerce showed the most significant scale-up during the period.
eCommerce didn’t just scale, it dominated the scaling behavior.
2) Scaling Efficiency: +264% Spend With Only ~20% CPA Increase
One of the easiest observed insights we could find in our analysis was the proportional scale up in ad spend vs. the overall impact on CPA. Our customers enjoyed the opportunity to optimize spend allocation and gain insights into the marginal results WHILE scaling. This allows our customers to scale spend by x2.64 , while their CPAs only increased by a factor of x1.2. We call that success!
That’s a strong signal that:
• incremental demand was still available at higher spend levels
• advertisers weren’t immediately hitting a steep diminishing returns wall
• the BFCM window provided enough incremental volume that scaling didn’t instantly punish efficiency
This isn’t always the case. During most of the year, pushing spend up aggressively often leads to CPA inflation (far above 20%). This is one reason BF season is unique - and also why it’s worth measuring properly instead of relying on blended CPA.
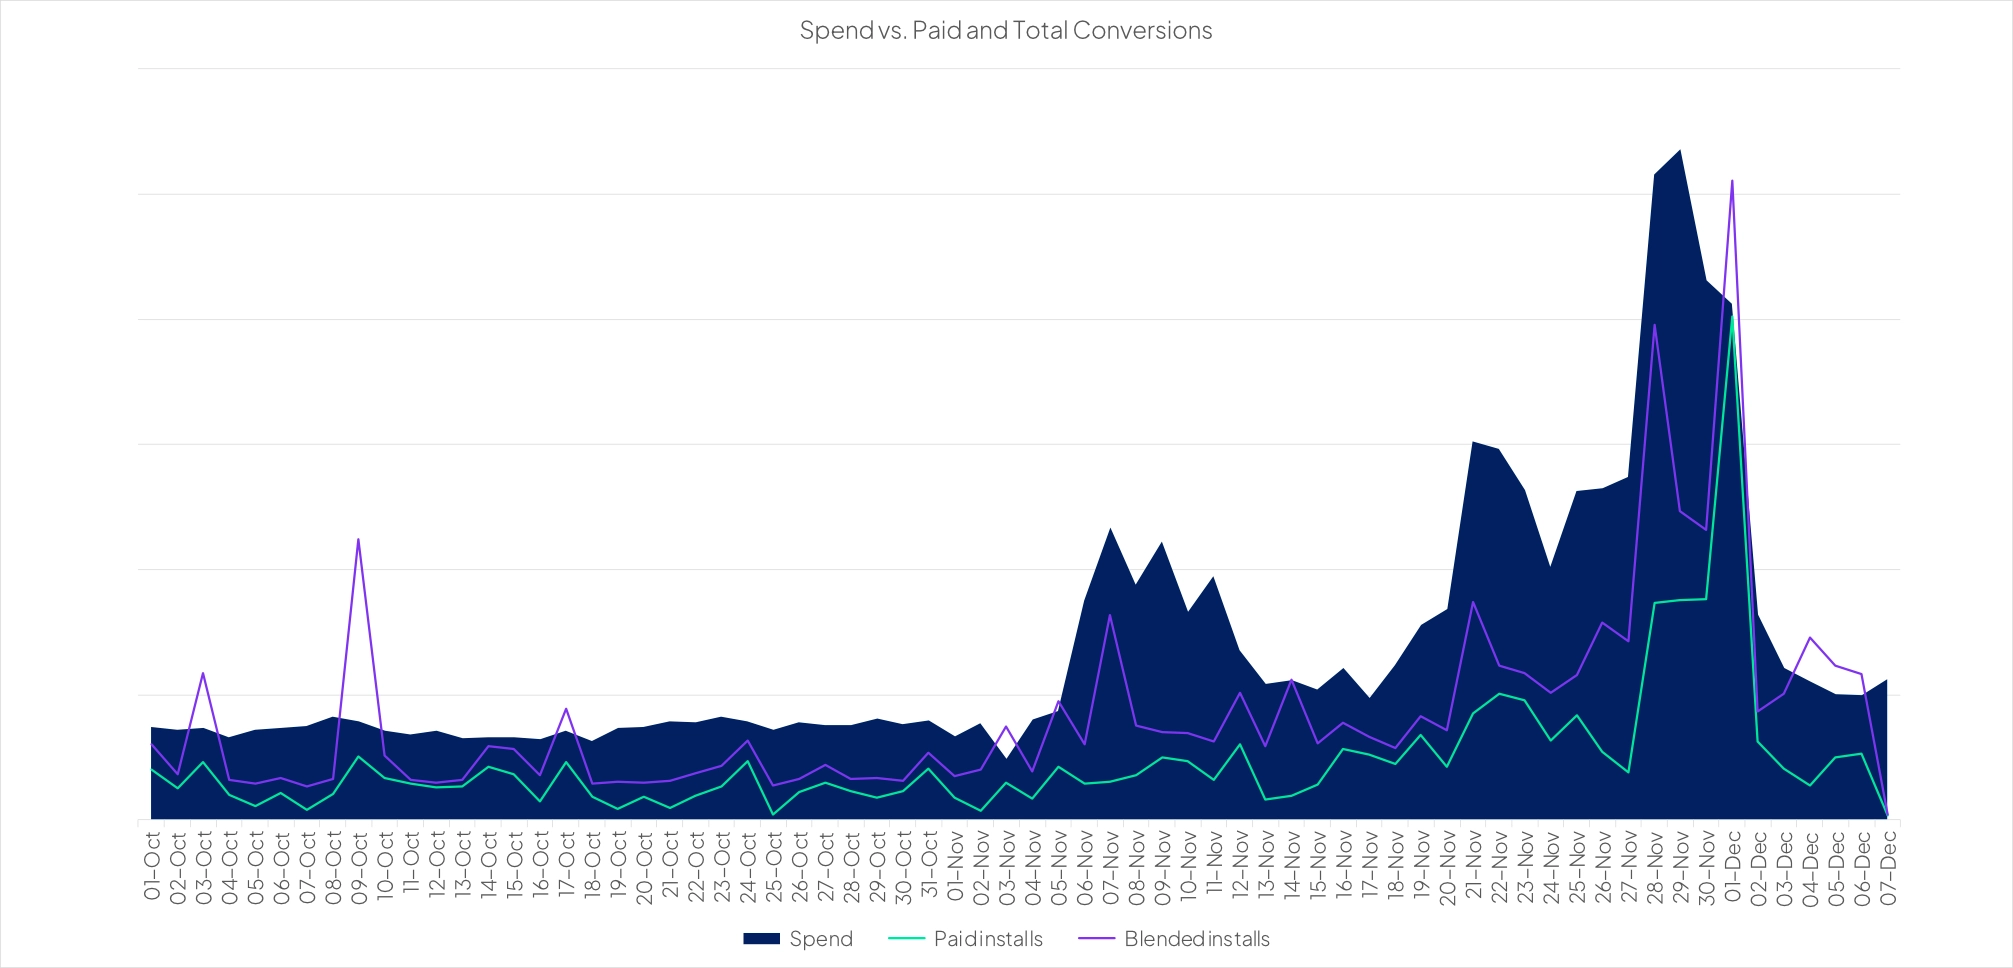
3) Conversions Spiked Exactly Where You’d Expect - Promotions Worked
Across our eCommerce customer base, we saw conversions peaking during each promotional moment:
• Singles Day (11/11)
• Black Friday (11/28)
• Cyber Monday (12/1)
…where the biggest impact came from Black Friday and Cyber Monday, driving both the highest spend and the greatest lift in conversions.
That may sound obvious, but it’s not trivial: peak-week attribution often makes it look like everything worked, everywhere.
Incrementality lets you isolate the true lift, and the pattern here is clean: promos drove measurable impact.
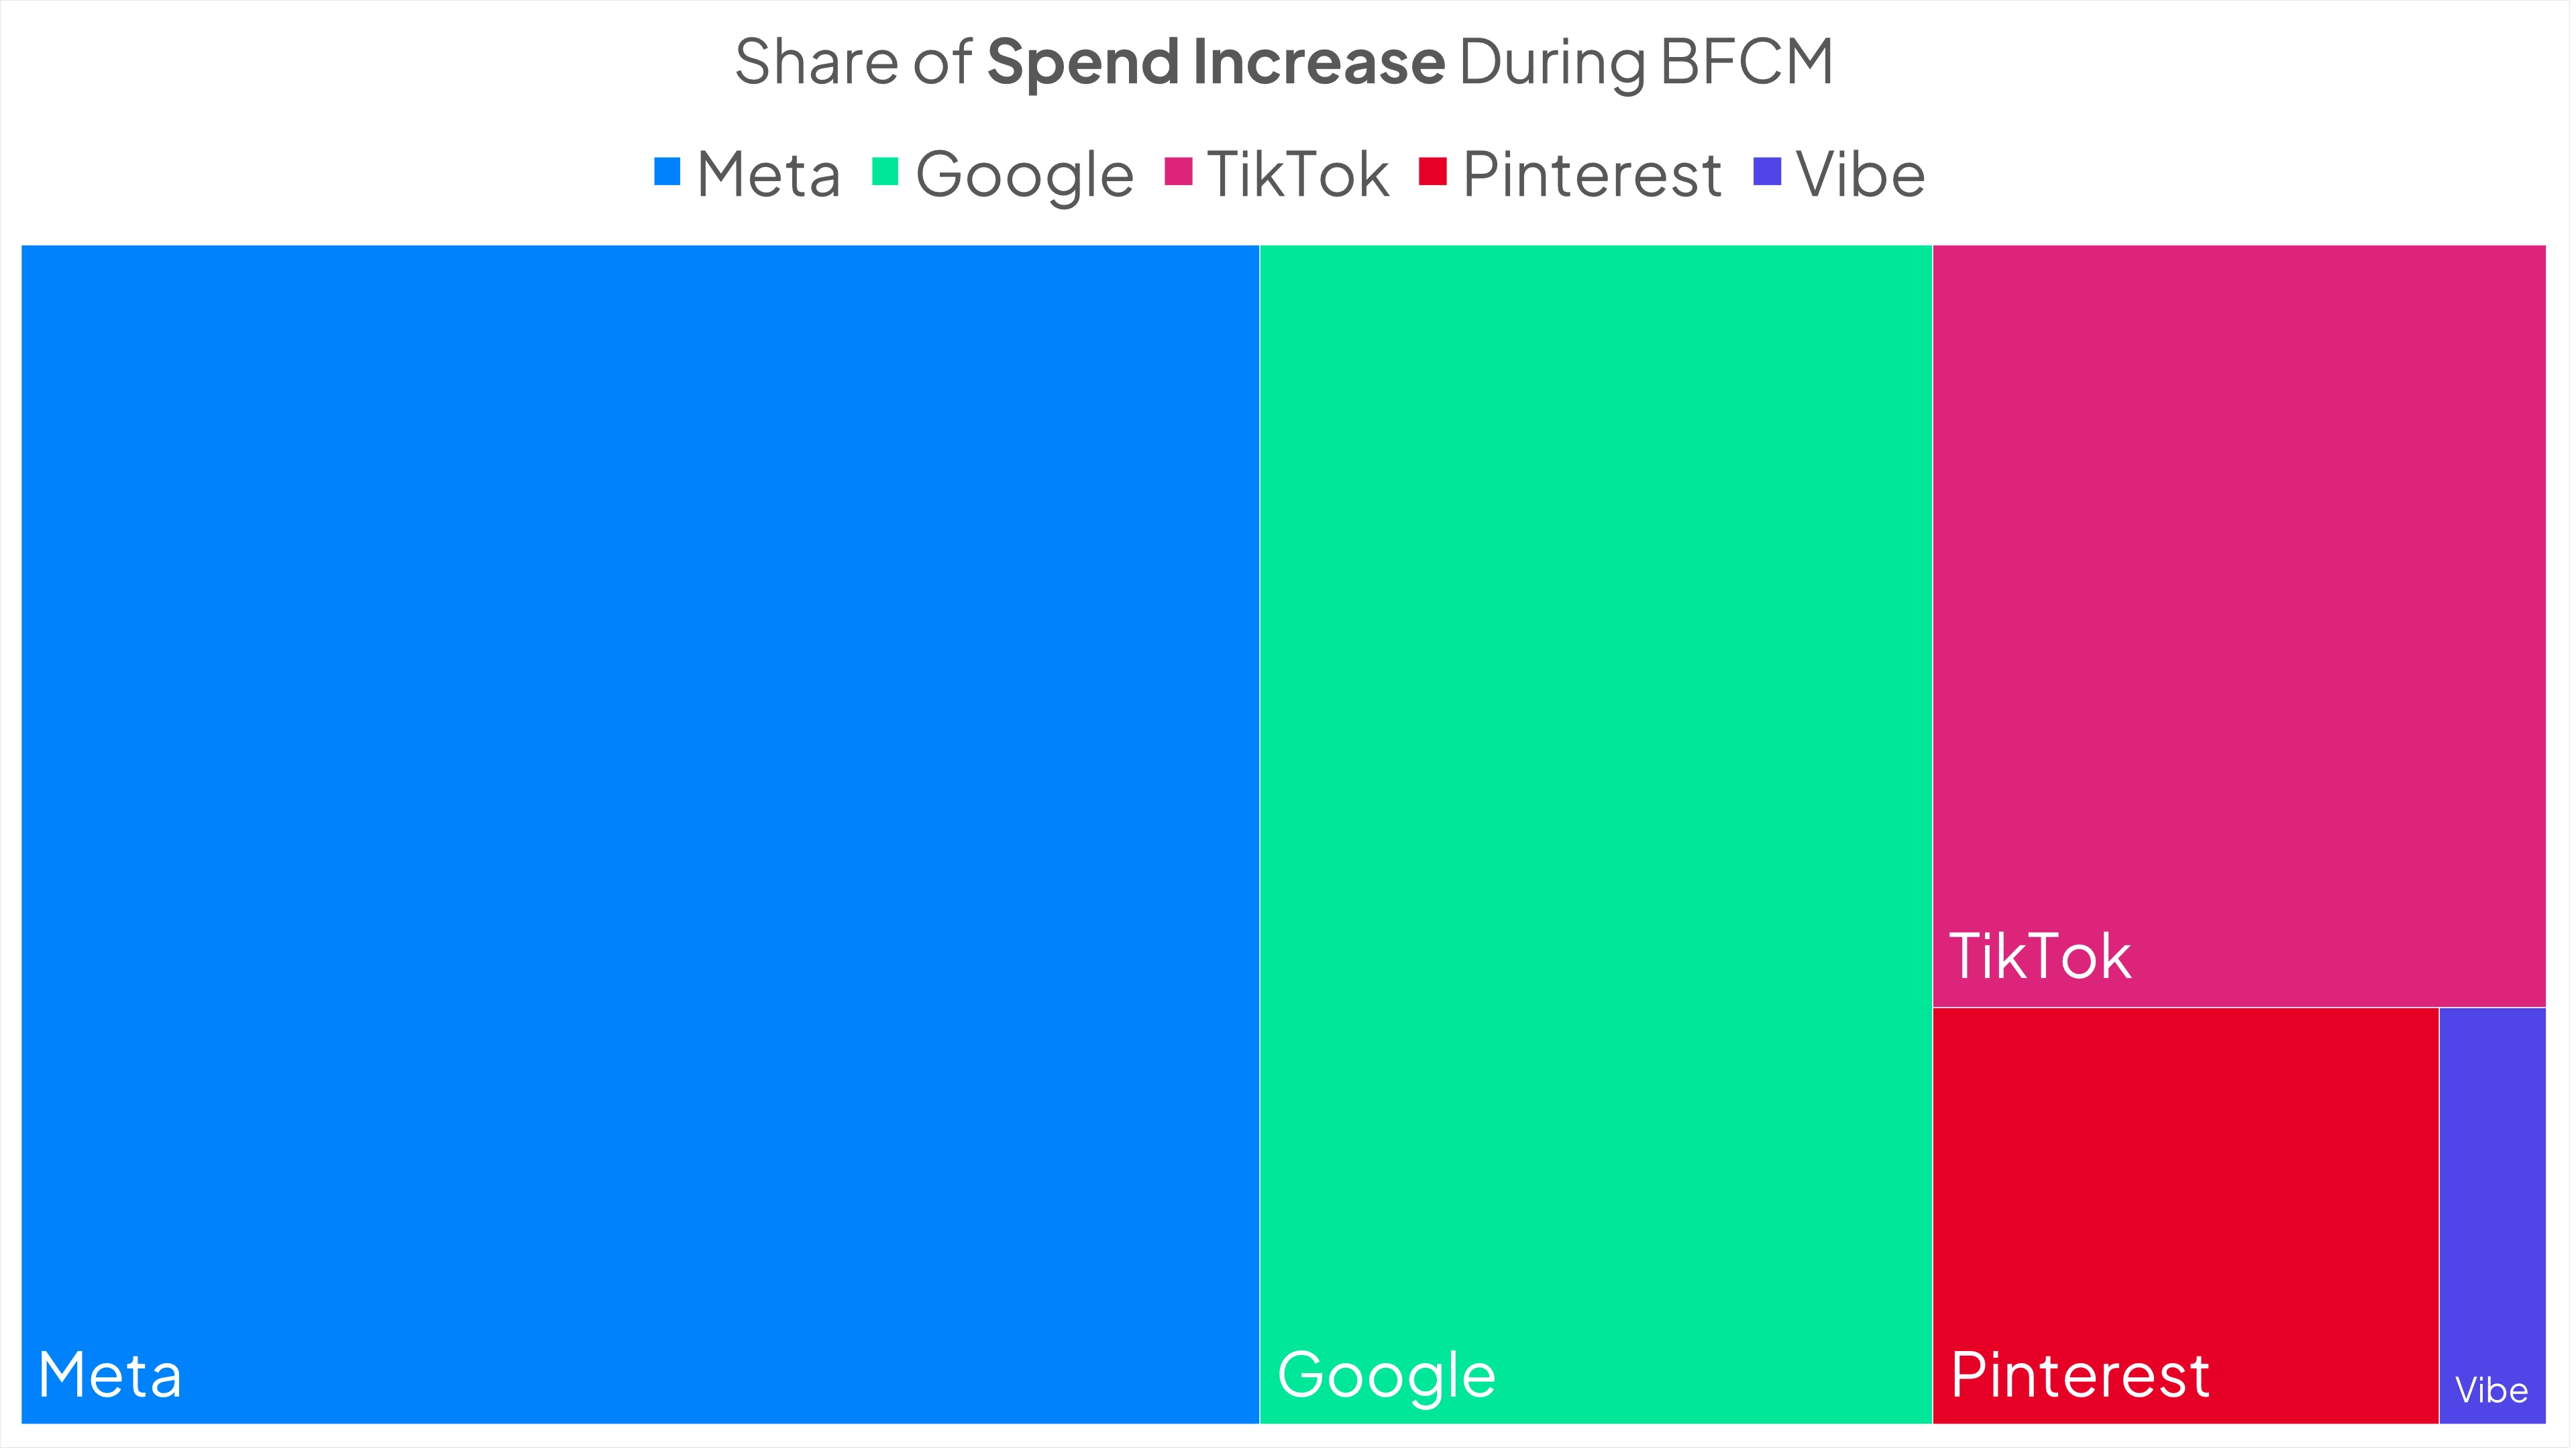
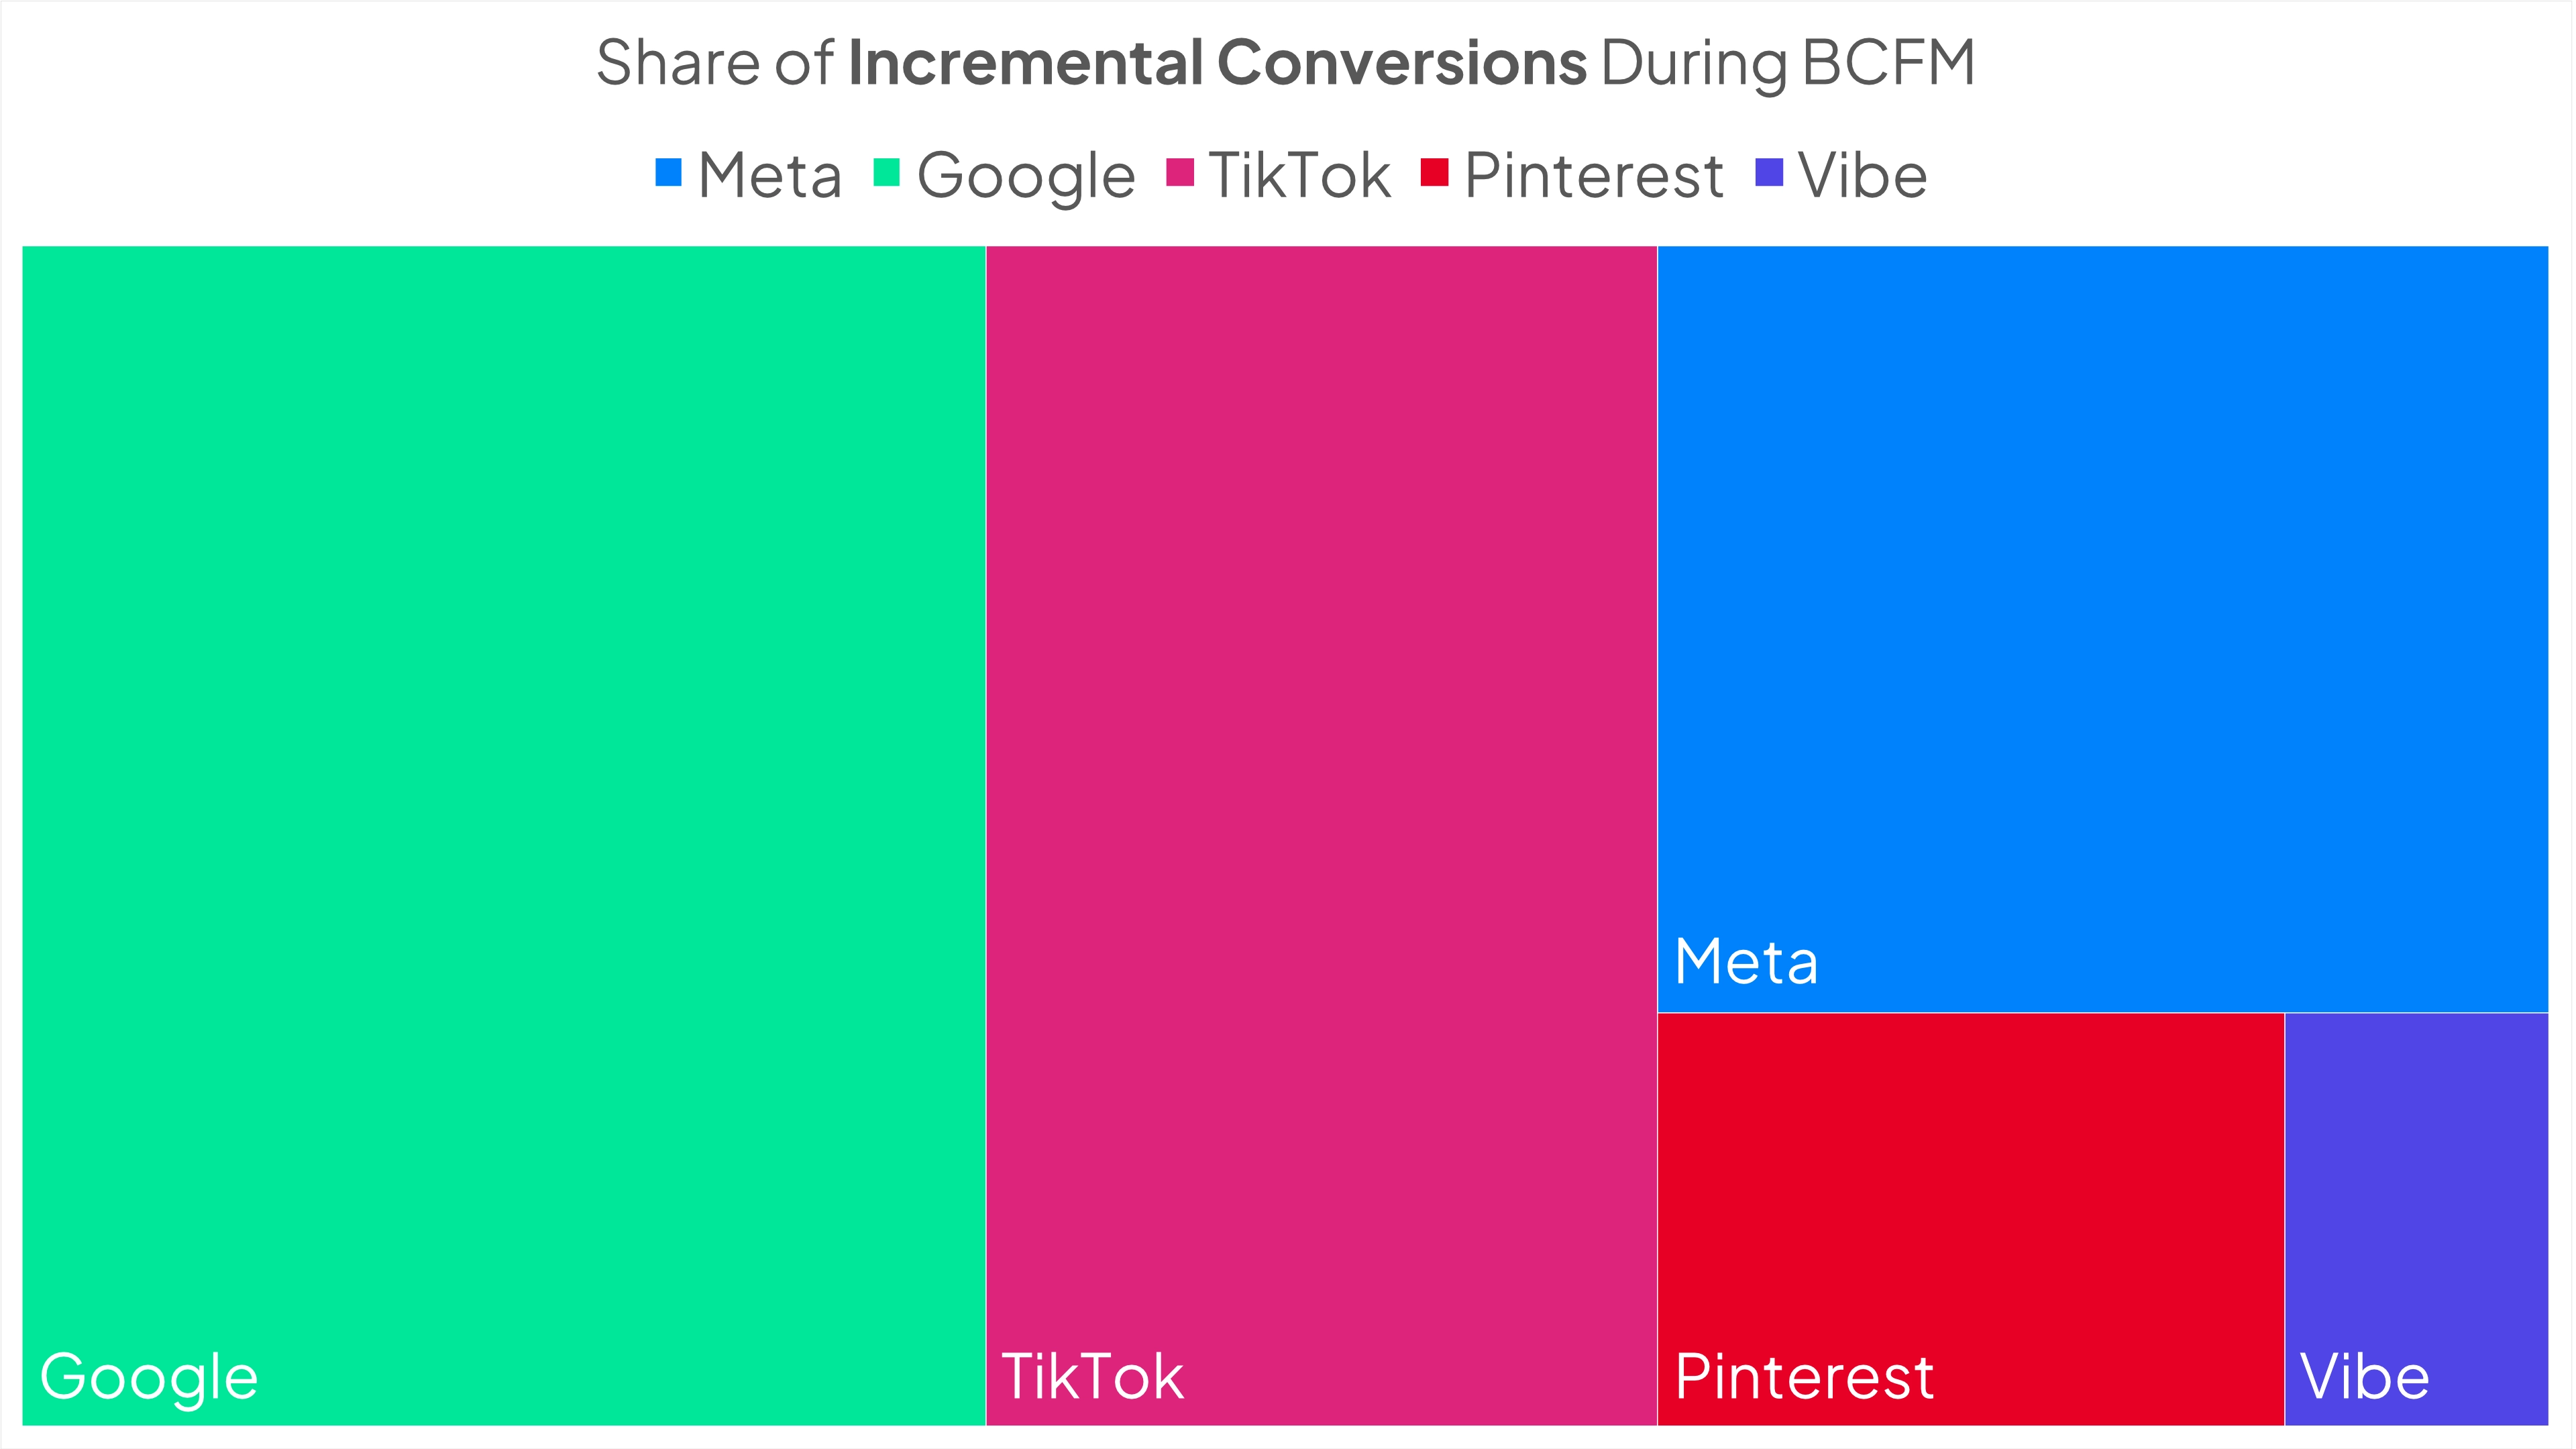
4) Channel Mix: Where did Advertisers ramp spend ?
Looking at channel share across the same timeframe, we see that the duopoly, and large platforms lead the chart when it came to incremental ad spend:
• Meta (Facebook, Instagram) led in spend. Out of the 265% increase in ad spend, Meta took almost 50% of that. Continue to the next insight we found to be shocked.
• Google (Search, YouTube, Display) took the second spot, landing 25% of the spend increase.
• TikTok was trending as well. Recent reports show that TikTok is generating substantial revenues from eCommerce with TikTok Shop.
• Pinterest also saw a nice bump in ad spend from eCommerce advertisers, having invested recently in new advertiser tools, and acquiring INCRMNTAL’s Partner: tvScientific
• And we should also mention newer platforms such as VIBE (CTV) who’s going all-on with eCommerce and mobile advertisers.
During peak periods, channel weighting matters a lot more than teams tend to admit. The “default allocation” isn’t always the optimal one when promo traffic is flooding the market.
5) Which channel brought the best return??
This is the insight you’ve been waiting for. That’s why we kept it to the end.
The incremental return on ad spend during the peak shopping moments was very different between the various ad platforms.
For every $1 of spend on
• Meta – Advertisers saw only around $0.55 returned
• Pinterest – Advertisers saw $1.43 returned
• Google – Advertisers saw $1.67 returned
• TikTok – Advertisers saw $1.98 returned(!)
But the clear winner during BFCM was VIBE. For every $1 spent during BFCM - Advertisers saw a return of almost $3!!
The insights about VIBE was not surprising to us, as it completely aligned with the CTV opportunity we reports in our CTV incrementality report, published in August 2025.
Black Friday season is the period when budgets spike, decisions get rushed, and measurement often becomes fiction.
Our analysis shows that incrementality measurement can reliably help customers make smart decisions even during the noisiest weeks of the year - and can clearly surface which campaigns, channels, and timing windows actually produced incremental outcomes.
• eCommerce was the biggest scaling vertical .
• Scaling was efficient: +264% spend with only ~20% CPA increase.
• Conversions spiked during promos, with BF and CM driving the biggest impact.
• Channel efficiency differed: Google and TikTok outperformed their spend share vs Meta.
• Return per $1 varied widely, with VIBE leading the observed set.
We hope that you gained some insights by reading this analysis, and will utilize this during your planning for the next shopping period.