
Platform
 Overview
 Integrations
Use Cases
Many Possibilities. One Platform.
 Marketing Changes
 Cross - Platform
 Everything
 Budget Allocation
AI and Automation
The Always-on Incrementality Platform
 Aurora
 Analyst
 Explorer
 Geolift
 Actionable Insights
 Media Mix Modeling
Solutions
Teams
Built for your whole team.
 Growth Marketers
 Marketing Analysts
 Data Analysts
Industries
Trusted by all verticals.
 Gaming & Entertainment
 Fintech
 Travel & mobility
 Lifestyle
 eCommerce & Retail
 Healthcare & Clinical Services
 Agencies
Mediums
Measure any type of ad spend
What do a Toy maker, a high-end Fashion designer, and a top electronics store have in common?
Not much. Different audience, different price points, different markets, different channel mixes. One sells to fans, one sells to the brand lovers, one sells to people who read spec sheets for fun (if you know, you know)
And yet, when we put their Black Friday sales spike under the INCRMNTAL analyst microscope, all three tell the same story.
Last year we looked at Black Friday from 30,000 feet: 50 Advertisers, $500M in ad spend, who scaled and which channels paid back. This time we zoomed in. Three eCommerce brands, one in Toys, one in Fashion, one in Electronics. Every marketing decision measured, every promotion analyzed.
The common story we found was that it was the deal making the selling, not the date. The promotion created the demand. Media is only as good as the deal it tags along to...
Advertiser | Avg. order | Media mix | Campaigns Type |
|---|---|---|---|
A | $70 | Search, Social | Brand and Performance |
B | $500 | Search, Social, Affiliates | Performance Only |
C | $1,000 | Search, Social, Affiliates | Performance Only |
How we measured. Two lenses, both from INCRMNTAL. Explorer, our always-on incrementality view, splits every week's sales into what each channel contributed.
Analyst isolates one change (a budget increase on Meta, or the Black Friday promotion itself) and measures its incremental effect over the 14 days before and after, at 95% confidence.
No holdouts. No attribution windows. No user-level tracking. Nobody had to switch off their ads during the most important week of the year.
When we say return, we mean incremental revenue per $1 of ad spend (incremental ROAS). When we say marginal, we mean the return on the extra spend only.
The Black Friday promotion was the hardest-working "channel" for all three brands.
These are the activities that no attribution platform would show you.
Advertiser | Ad spend change (14 days after vs before) | Share of extra sales driven by the promotion |
|---|---|---|
A | -8% | 112% |
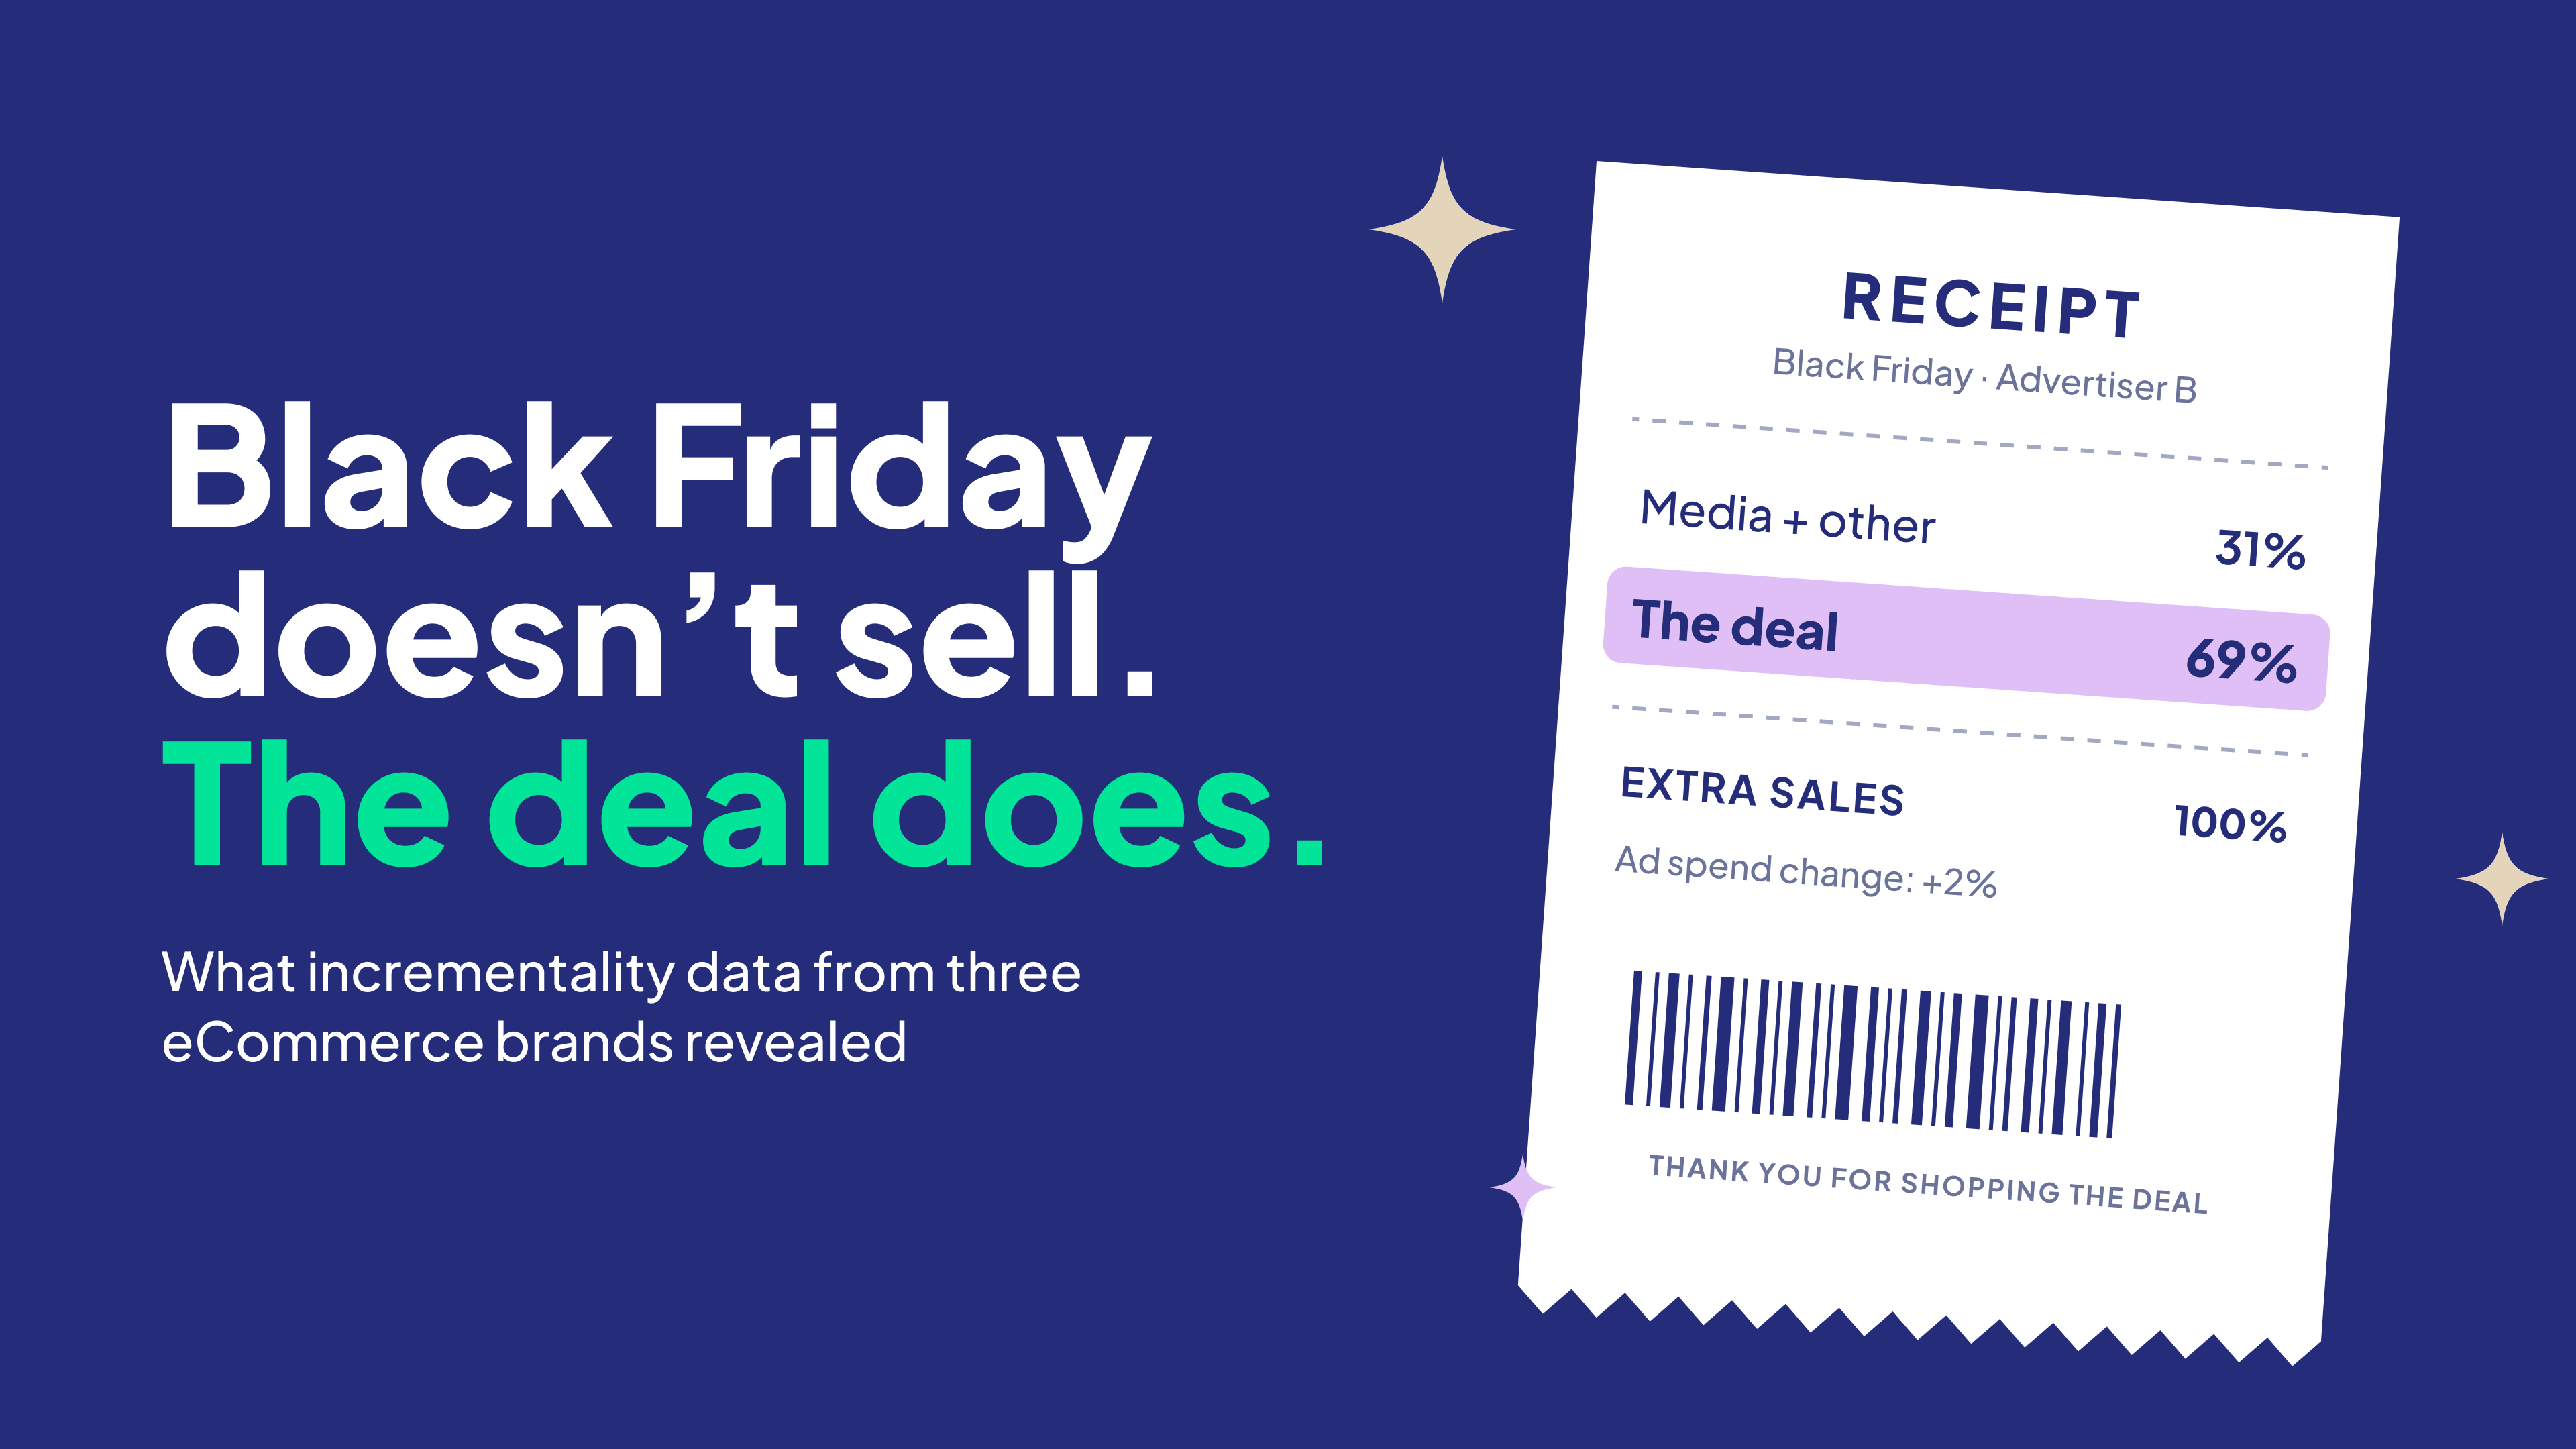
B | +2% | 69% |
C | +28% | 46% |
Advertiser A's promotion produced $1.96M in incremental revenue in the two weeks after Black Friday, more than the whole business grew ($1.75M). All while ad spend went down.
Advertiser B barely touched its budget, and the promotion delivered two-thirds of the extra sales.
Advertiser C is the exception that proves the rule: it added 28% more spend, so the deal's share was smaller and Google did much of the rest.
Attribution has no line item for "we're running a sale". Advertiser C's attributed ROAS went from 15.7x before Black Friday to 19.2x after. Attribution's verdict: media got better. Incrementality's verdict: almost half the extra revenue was the deal.
Attribution LOVES to claim conversions that came from a promotion.
54% of Advertiser A's promotion-driven transactions came from first-time buyers. Black Friday isn't just harvesting existing customers. It's an acquisition event.
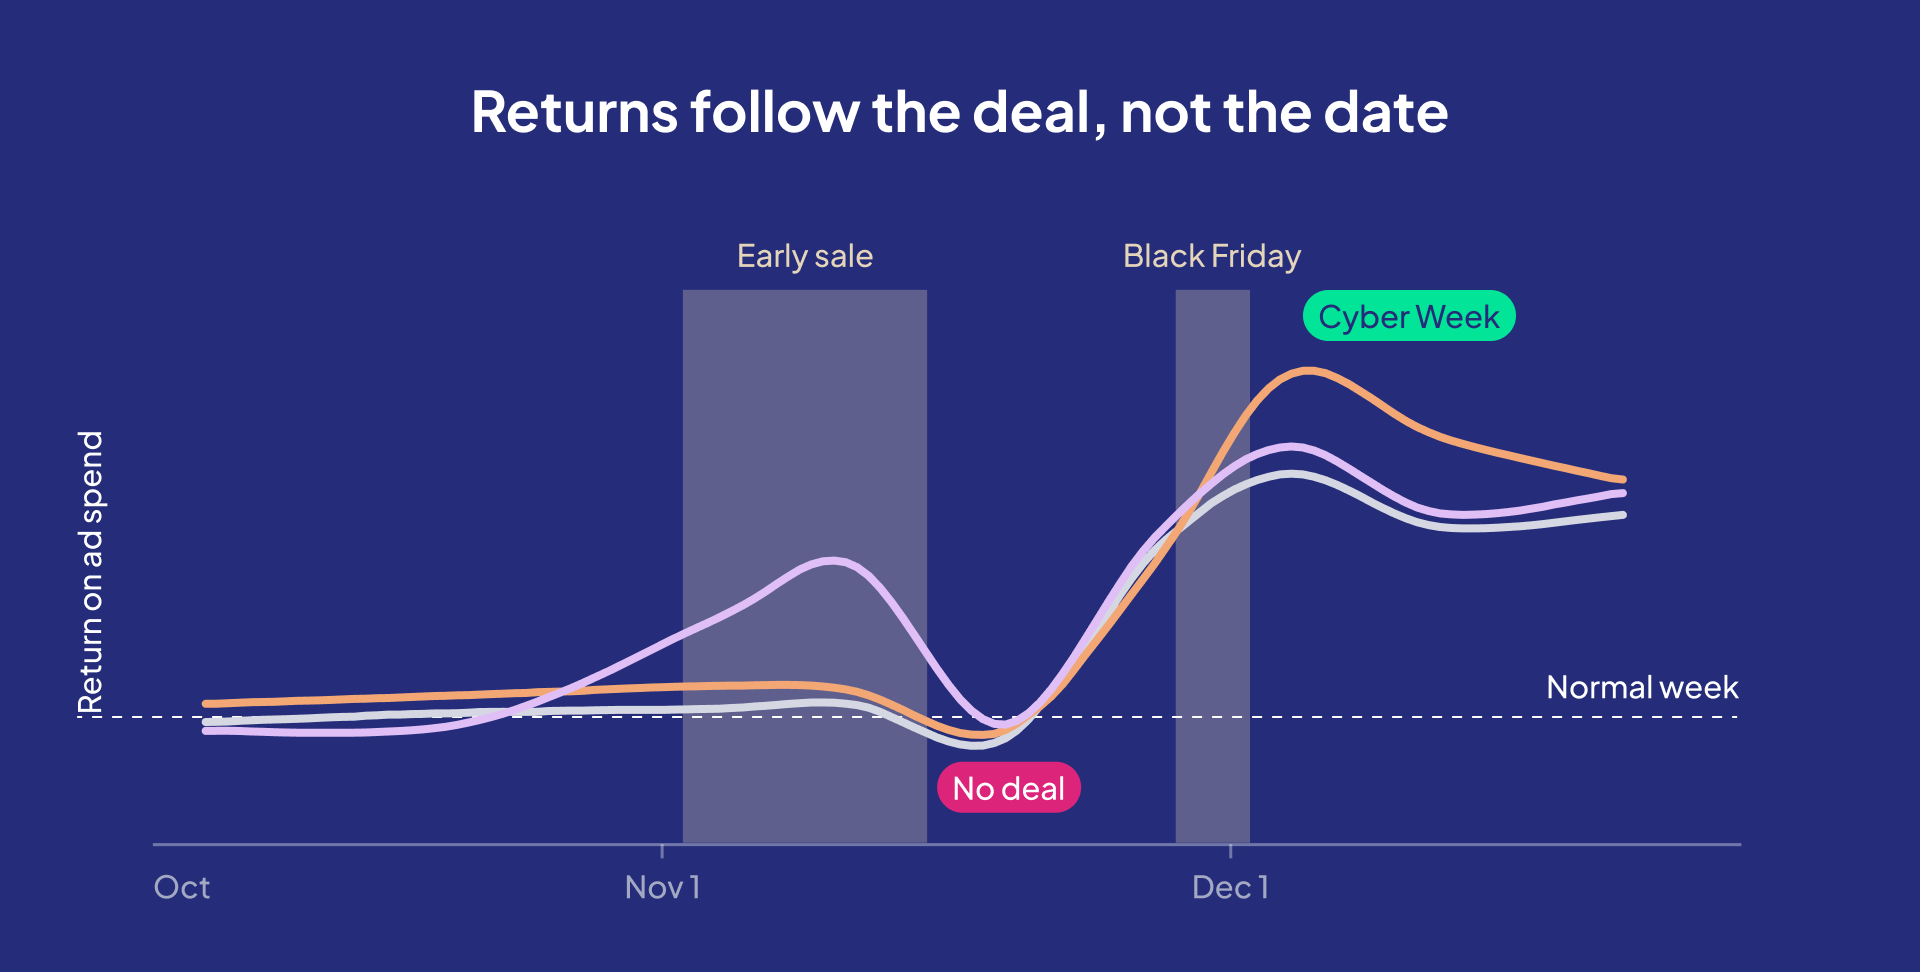
Illustration of the weekly pattern described below, not plotted data.
Advertiser B ran two promotions: one at the start of November, and one for Black Friday. In its early-November sale week, every $1 of paid media returned $6.30 in incremental revenue. The next week, with no deal live, that fell to $2.57. Right back to its October levels. Then Black Friday started, and it jumped to $6.79.
Notice something? Advertiser B's early-November sale performed almost as well as Black Friday itself. The magic isn't the date on the calendar. It's the deal.
Advertiser A had no early sale, so its no-deal week was the week before Black Friday. Return per $1 dropped from $5.70 in early November to $2.82, the worst week of its season.
The kicker: that week Advertiser B cut spend in half, Advertiser A raised it 69%, and both got the worst return of their season. That's not a bidding problem. That's audiences keeping their wallets in their pockets until the deal goes live.
Normally, the more you spend, the more each extra sale costs (diminishing returns). During a promotion, that curve bends.
We've written plenty about the Balloon Effect: squeeze more budget into a channel and the marginal cost per result inflates. Black Friday is the one time of year the balloon itself gets bigger.
The best returns of the season came after Black Friday, right when budgets were being cut (see the chart in "No deal, no lift").
Lower spend helps, sure. But Advertiser B was spending ~2x its October budget in mid-December and still earned ~3x more per dollar. The demand didn't go home after Cyber Monday. The budgets did.
A fair counterpoint: Organic sales fell ~40% in December, so some demand was pulled forward into Black Friday. But the paid media that stayed on kept paying back. The ones who left the party early paid for it.
If you buy media, here's what we'd change in the next three weeks.
Black Friday is the loudest week of the year for your attribution reports, and the quietest one for the truth. This November: measure the deal, fund the margin, and stay for Cyber Week.
So, what are you planning around this year?
Want to see what your Black Friday actually does? Talk to us.

Maor is the CEO & Co-Founder at INCRMNTAL. With over 20 years of experience in the adtech and marketing technology space, Maor is well known as a thought leader in the areas of marketing measurement. Previously acting as Managing Director International at inneractive (acquired by Fyber), and as CEO at Applift (acquired by MGI/Verve Group)
 iOS
 Android
 Web
 TV
 Influencer Marketing
 Out of Home
 In game
 Podcast
 About Us
 Contact